
How to create a Pie chart in Word
Microsoft Word offers a variety of charts, including the Line chart, Area chart, bar graph, and pie chart. A Pie chart is the most popular type of chart that is used to display data, information, and statistics in a circular form. Pie Chart is also known as Pie Graph, circle graph, and circle chart.
Create a Pie Chart
There are the following steps to insert a pie chart in Word document –
Step 1: Open the Word document.
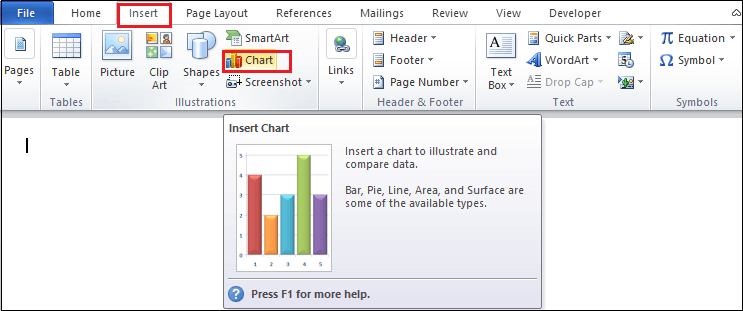
Step 2: Place the cursor in the document where you want to create a pie chart. Now, Go to the Insert tab on the Ribbon and click on the Charts icon under the illustrations group.
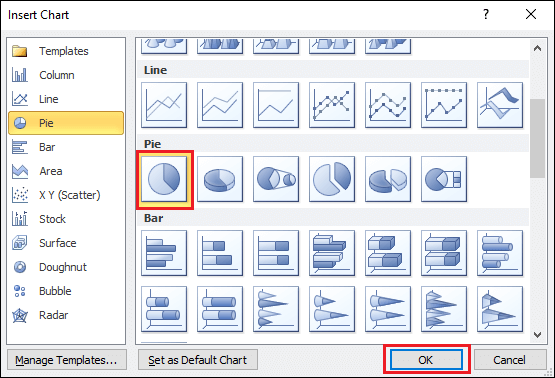
Step 3: An Insert chart dialog box will appear on the screen. Choose any pie chart that you want to insert in Word document, and click on the OK button at the bottom of the screen.
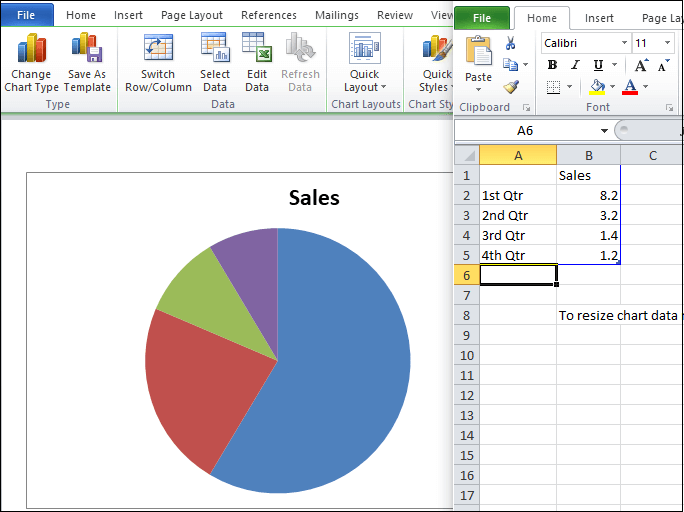
Once you click on the OK button, the Pie chart and an excel spreadsheet appear on the screen.
Add data in Pie Chart
Once you create a Pie chart in Word document, you can add data in it based on your requirement.
To add data, go to the excel spreadsheet and start adding data.
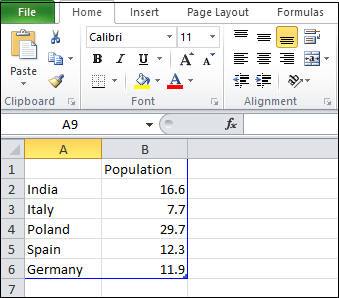
The screenshot below shows that your desirable data is added to the Pie chart.

Advantages of Pie chart
A list of advantages of a Pie chart is given below –
- A Pie chart is easy and simple to understand.
- It offers an effective communication way to the audience or readers.
- It provides immediate analysis and quickly understandable information.
- It provides an excellent visual representation of data.
- It requires fewer additional explanations.
- It is simpler than other types of graphs.
Disadvantages of Pie chart
There are the flowing disadvantages of Pie chart –
- If there are a large number of data pieces to use, then Pie chart becomes less effective.
- It is difficult to reveal exact values form the data.
- Difficulty in representing multiple sets of data.
- In a Pie chart, there is a problem in comparison of data slices.


