
Analysis ToolPak
Microsoft Excel provides a lot more features than you can ever think of. Data analysis is one of the greatest features that Excel provides to its users. Using Excel’s Analysis ToolPak, one can generate complex statistical or engineering analyses.
In this tutorial, we will briefly learn about the Analysis ToolPak feature along with its functions.
What is Analysis ToolPak?
“The Analysis ToolPak is a built-in add-in program that offers data analysis tools for various financial, statistical and engineering problems.”
Analysis ToolPak fetches the result in an output table by using the relevant statistical or engineering macro functions. This remarkable tool surely saves time and effort by providing the data and parameters for every analysis.
Though there are plenty of analysis functions, you can use only one function on your Excel worksheet. Sometimes you may work on grouped worksheets, and for those cases, the result of data analysis will be displayed on the first spreadsheet, and other formatted tables will be shown on the remaining spreadsheet. But if you wish to execute data analysis on the remaining worksheets, recalculate the analysis tool for each excel spreadsheet.
How to load Analysis ToolPak in Excel?
To install the Analysis toolpak in your Excel worksheet, follow the below-given steps.
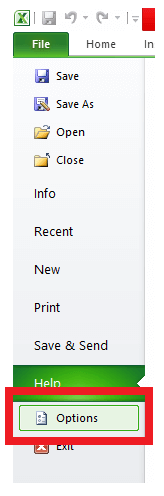
- Open your Excel worksheet, and from the Excel, ribbon toolbar click on File.

- The File window will appear (as shown below). Click on ‘Options’.
- Next, the Excel options window will open. On the left-hand side of the window, you will see various options. Click on the ‘Add-Ins’ option.

- Make sure to select the Excel add-in from the manage box (near the bottom) and click on the Go button.

- Excel will throw the Add-ins dialog box. Select the Analysis ToolPak check box, and click on the OK button.

- You will notice in the Data tab a new ‘Analyze’ section will appear containing the Data Analysis feature.

That’s it! Now your analysis tools are successfully installed in your Excel workbook.
Data Analysis Functions
After clicking on the ‘Data Analysis’ option, the following window will appear displaying different analysis tools options, which allows the user to analyse the data properly and help them to perform different statistical tests to fetch appropriate outputs.
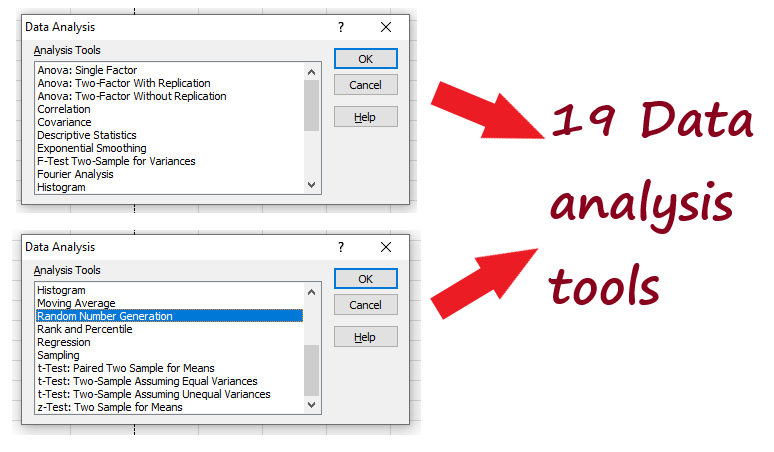
The above window shows 19 options. Below given is the table containing those 19 options along with their short description:
| S.NO. | Analysis Tools | Description |
|---|---|---|
| 1 | Anova: Single Factor | It concludes whether two data sets are related to each other or not by conducting an analysis of variance. |
| 2 | Anova: Two-Factor with Replication | This is the extension of Anova: Single Factor. It concludes whether two data sets are related to each other or not by conducting an analysis of variance. The only difference here is that it can include more than one sample of data for each group. |
| 3 | Anova: Two-Factor Without Replication | It concludes whether two data sets are related to each other or not by conducting an analysis of variance. However, this analysis tool does not include more than one sample of data for each group. |
| 4 | Correlation | Correlation determines the degree to which two paired variables are in relationship to each other. |
| 5 | Covariance | Covariance measures the change in one variable when the other variable changes. Covariance can be positive or negative. |
| 6 | Descriptive Statistics | This tool calculates a range of statistical computations and compiles them into an excel table. This table includes calculations for mean, mode, median, sum, standard deviation, error, largest, smallest, sample variance, kurtosis, count, range, min, max etc. |
| 7 | Exponential Smoothing | This tool is used to smooth the data i.e, more weightage is given to recent data files. |
| 8 | F-Test Two Sample for Variance | An F-Test is used to compare two population variances. The null hypothesis is that the variances of the two populations are the same. |
| 9 | Fourier Analysis | Fourier Analysis resolves problems in linear systems and examines periodic data by using DFT (Discrete Fourier Transform) method or FFT Fast Fourier Transform) method. |
| 10 | Histogram | Histogram tool allows the user to create data distributions and histogram charts. |
| 11 | Moving Average | Moving average is used with time series data i.e. data taken over time like electricity expenditure over days or stock price of company ABC over time or units sold of item A etc. It is used to smooth out the short-term fluctuations (or maybe seasonal fluctuations) and highlight longer-term trends. |
| 12 | Random Number Generation | It is used to generate a random number of different types such as Discrete, Uniform, Normal, Bernoulli, Poisson, Patterned, etc. |
| 13 | Rank and Percentile | This tool constructs a list of the numbers ordered from highest to lowest and gives a percentile value that shows how a specific number ranks compared to the other numbers. |
| 14 | Regression | Regression is used to estimate relationships between 2 or more variables – a dependent variable and independent variable(s). In simple terms, the independent variables form an equation which helps in estimating the value of the dependent variable. |
| 15 | Sampling | The Sampling tool is used to produce a data sample population either randomly or periodically. |
| 16 | t-Test: Paired Two Sample for Means | This analysis tool is used to test the null hypothesis for two Paired samples. |
| 17 | t-Test: Two-Sample Assuming Equal Variances | This analysis tool is used to test the null hypothesis for two Paired samples with equal means. |
| 18 | t-Test: Two-Sample Assuming Unequal Variances | This analysis tool is used to test the null hypothesis for two Paired samples assuming unequal variances. |
| 19 | Z-Test: Two-Samples for Mean | Z-Test is used to compute the means of two data samples with known variances. |
Each analysis tool has its own importance and is used by statisticians in different calculations.


