
Everything about Standard Error in Excel
Standard Error definition
Standard error is one of the important statistical indicators. You can use this indicator to determine the heterogeneity of a sample. This is also very important in forecasting.
There are doubts about the accuracy of the statistics – even when following procedures and using efficient testing equipment. In Excel, there are statistical formulas that we can use to calculate uncertainty. Standard error will help with that.
Standard error example
The idea of a standard error is very theoretical. To better understand this measure, it is necessary to refer to the theory of parameter estimation. To better illustrate the phenomenon described let’s see an example.
Let’s say you want to measure what is the average height in the population of employees in your company. To obtain the exact value of the average population growth, you would have to study all employees. From a practical point of view in huge companies, this is impossible and unprofitable. You decided to measure the height of the people in your team only. Is this the actual average height in the company as a whole? Most likely not! This might be close to the actual value, but is most likely not identical.
The mean of the sample (your team) is an estimator (approximation) of the real value in the population. If you decided to measure the average height in other teams you would have receive an average score for each test (for each study). Each time, this result would be an “approximation” of the real average height.
A standard error is a measure of the variation of these averages from measures in teams. The more measurements you take, the more accurate the result you get. Also standard error will decrease.
Standard Error calculations
To calculate Standard Error you need to calculate the standard deviation first and to know the total number of samples. You can calculate standard error step by step or to use the Excel standard error formula.
Standard Error = Standard deviation / square root of total number of samples
=STDEV(range)/SQRT(COUNT(range))
From the theory and from the equation you may be sure that standard error of the mean is always lower than the standard deviation.
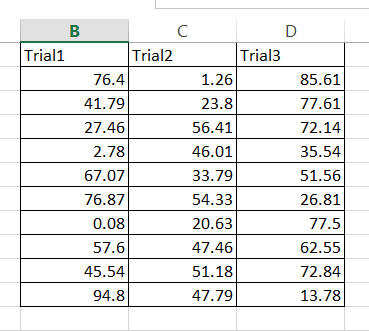
Let’s assume the real example. I have three data sets. One per each trial. I have prepared the data and put the values in the table.
Calculate Standard Error step by step
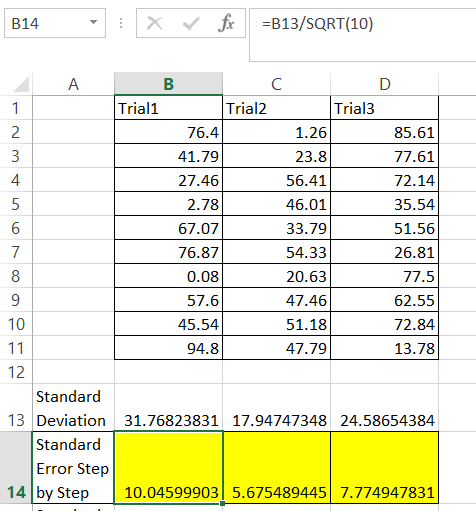
First to calculate standard error you need to calculate standard deviation. I used =STDEV.S(B2:B11) Excel formula.
Then you need to know the number of samples. In my basic example there are 3 trials per 10 values each.
The final standard error formula is =B13/SQRT(10)
Calculate Standard Error using formula
However knowing the formula you are able to calculate the same using just one single formula.
=STDEV.S(B2:B11)/SQRT(COUNT(B2:B11))
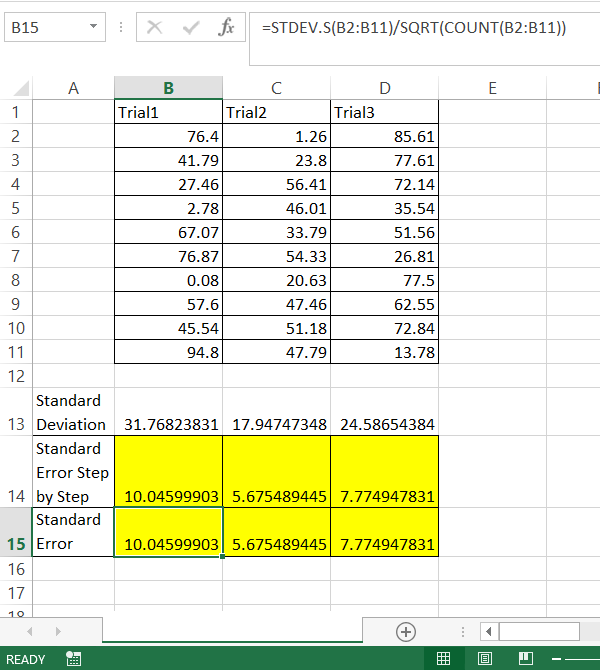
The result is the same.
Calculate Standard Error using Data Analysis
The another method is to use Dana Analysis Toolpak installed. This method you can use to get the whole set of statistics data (standard error included).
First you need to make sure your Data Analysis Toolpak Add-In is installed.
Here is the lesson how to install Data Analysis Toolpak Add-In.
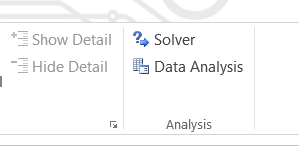
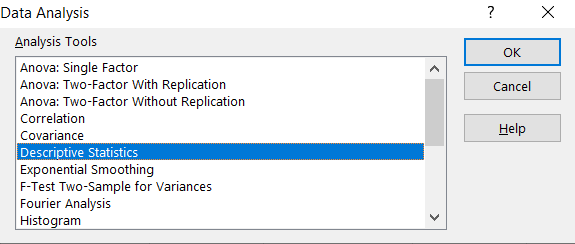
Go to Ribbon to the Data tab. Click the Data Analysis button.
New window appears. Choose Descriptive Statistics and click OK.
Enter the proper parameters:
- Input Range – range of your data ($B$1:$D$11 in my example)
- Labels in first row – there are labels in my data table
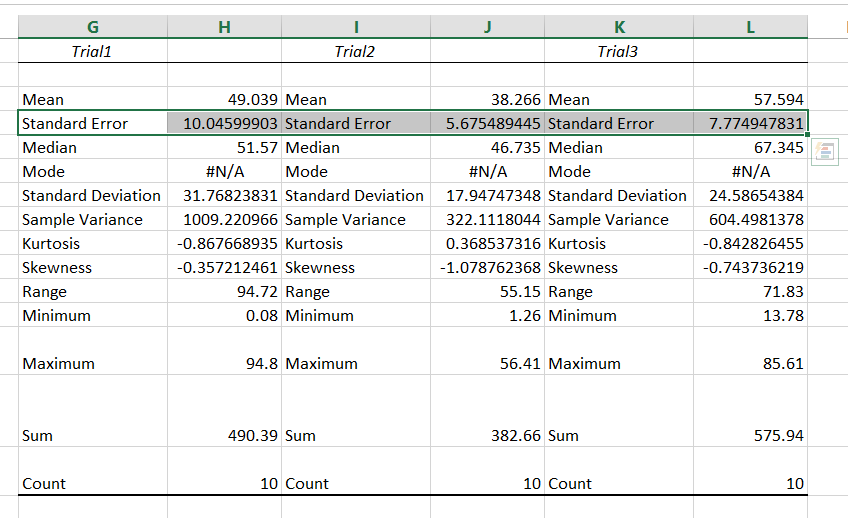
- Output Range – choose where you want to get your standard error calculated (I chose the same Sheet $G$1:$L$15)
- Summary statistics – make sure it is checked
And this is how to see my Statistics summary. Standard Error you can find in row 4.
How to show Standard Error of the Mean (SEM) in the Chart?
You may want to show the Standard Error of the mean in the chart. Let’s see how to do that.
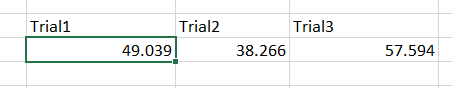
To get SEM first calculate mean for each trial. Use Excel average function. The formula is =AVERAGE(B2:B11)
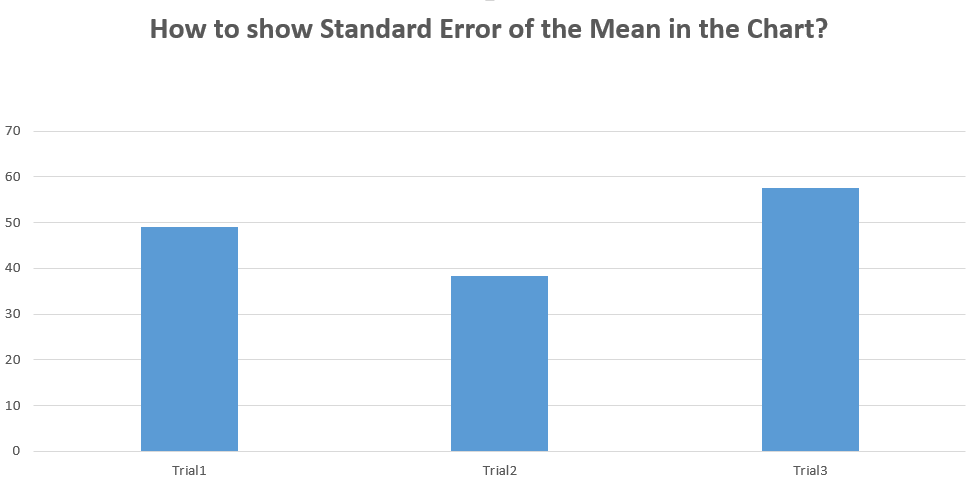
Then insert the column chart. Just highlight the data, go to the Ribbon to the Insert tab and choose column chart. The basic chart is visible.
This was easy. The more difficult part is to insert sem. To do that click the plus sign on the right side of your chart. Next choose error bars and more options.
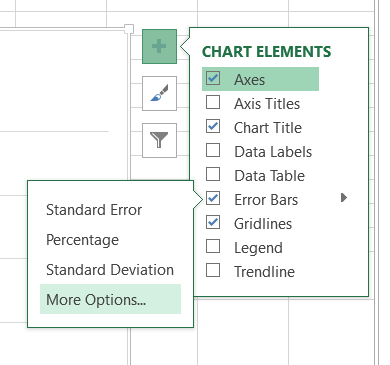
In the dialogue choose Custom and click Specify Value.
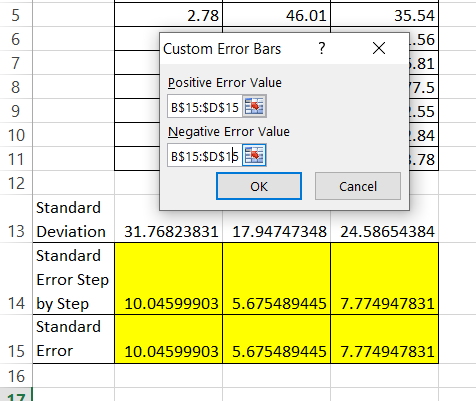
For both Positive Error Value and Negative Error Value highlight your calculated Standard Error values.
Now you can see Standard Error lines in the chart.
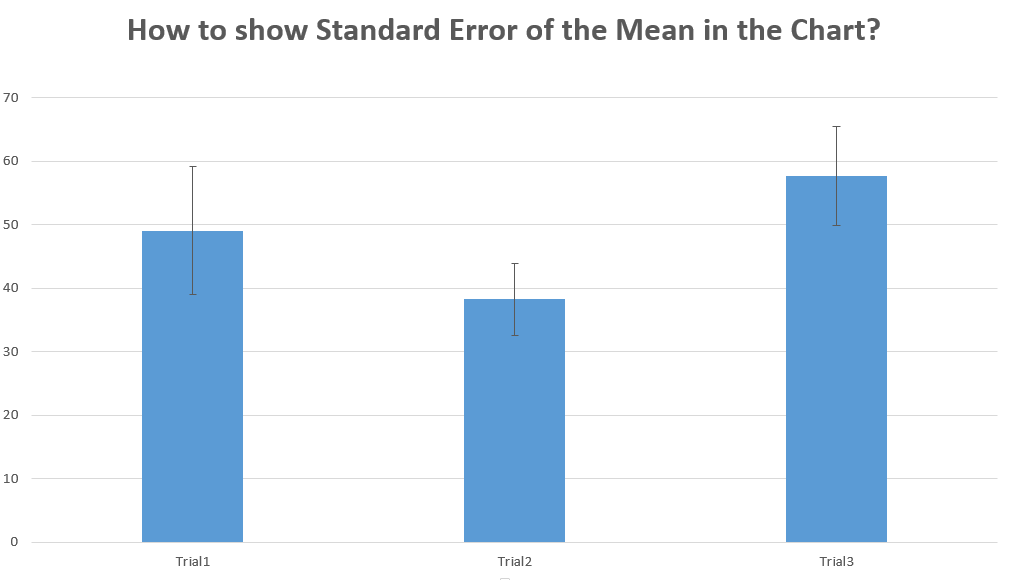
It is showing additional information for columns you show in the chart. The bigger the standard error the less accurate the data presented in columns.
Template
Further reading:
Basic concepts
Getting started with Excel
Cell References


