
Power BI Tutorial
Power BI is one of the most popular Data Visualization and Business Intelligence tool. The Power BI tool is the collection of apps, data connectors, and software services which are used to get the data from different data sources, transforms data, and produces useful reports.
Power BI services are based on SaaS and mobile Power BI apps that are available for different platforms. These set of services are used by the business users to consume data and to build Power BI reports.
This tutorial helps you to clear all the essential concepts in Power BI and provides enough knowledge on how to use Power BI or how to work on Power BI.
In this tutorial, we will discuss the following topics:
- What is BI?
- What is Power BI?
- Power BI History
- Power BI Components
- Power BI Architecture
- Power BI Tools
- Power BI Advantages
- Power BI Disadvantages
- Download and Install Power BI Desktop
- Power BI Dashboard
- Power BI Reports
- Difference between Dashboards and Reports
- Power BI Data Sources
- Power BI Embedded
- Power BI Gateway
- Building Blocks of Power BI
- Power BI Report Server
- Power BI DAX
- Who uses Power BI?
What is BI?
The BI term refers to Business Intelligence. It is a data-driven decision support system (DSS), which helps you to analyze the data and provide actionable information. It helps the business manager, corporate executives, and other users in making their decisions easily.
Business intelligence refers to the applications, technologies, and practices for the collection, analysis, integration, and presents the business information. The purpose of business intelligence is to support better decision making.
Sometimes the business intelligence is used interchangeably with briefing books, reports, query tools, and executive information systems.
The below image shows the benefits of business intelligence, such as:
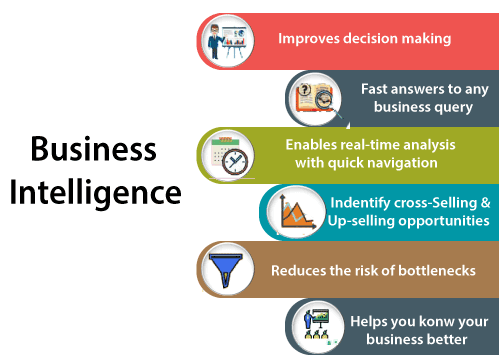
Importance of BI
Business intelligence is used to improve all parts of a company by improving access to the firm’s data and then using that data to increase profitability. Companies that practices BI can translate their collected data into insights their business processors.
Then the insights can be used to create strategic business decisions that improve productivity and accelerate the growth.
Some more potential benefits of business intelligence tools include:
- Driving new revenues.
- It increases operational efficiency.
- It optimizes internal business processes.
- It improves decision making.
- It is gaining a competitive advantage over business rivals.
- It is used in spotting business problems that need to be addressed.
- It can be used in assisting companies in the identification of market trends.
Types of BI Tools
BI combines a broad set of data analysis applications that includes:
- Mobile BI
- Real-time BI
- Operational BI
- Open-source BI (OSBI)
- Collaborative BI
- Location intelligence (LI)
- Software-as-a-service BI (SaaS BI)
- Online analytical processing (OLAP)
- Ad hoc analytics
What is Power BI?
Power BI is a Data Visualization, and Business Intelligence tool which helps to convert data from different data sources into interactive dashboards and BI reports. It provides interactive visualizations with self-service business intelligence capabilities where end users can create reports and dashboards by themselves, without having to depend on information technology staff or database administrators.
Power BI provides multiple connectors, software, and services. These services based on the SaaS and mobile Power BI apps which are available for different platforms. These set of services are used by business users to consume data and to build BI reports.
Power BI desktop app is used to create reports, while Power BI Service (Software as a Service – SaaS) is used to publish those reports. And Power BI mobile app is used to view the reports and dashboards.
Different Power BI version like Desktop, Service-based (SaaS), and mobile Power BI apps are used in different platforms.
Why Power BI
Here are some significant reasons to use the Power BI tool:
- It allows real-time dashboard updates.
- It provides secure and reliable connections to the data sources in the cloud.
- It allows data exploration using a natural language query.
- Power BI provides a hybrid configuration, quick deployment, and secure environment.
- It provides features for dashboard visualization regularly updated with the community.
- It provides pre-built dashboards and reports for SaaS solutions.
Power BI History
- Power BI was thought by Ruler and Dhers Netz of the SQL server coverage services team at Microsoft.
- Power BI was designed by the West Chadic George in 2010 and named as a Project Crescent. In 2011, it was tied up with SQL server codenamed Mount McKinley.
- In September 2014, Microsoft revealed the first preview to Power BI.
- The first version of Power BI is released on 24 July 2015. It was based on Excel-based Add-ins such as Pivot, view, Power Query, and Map.
Power BI Components
The components of Power BI are shown as below:
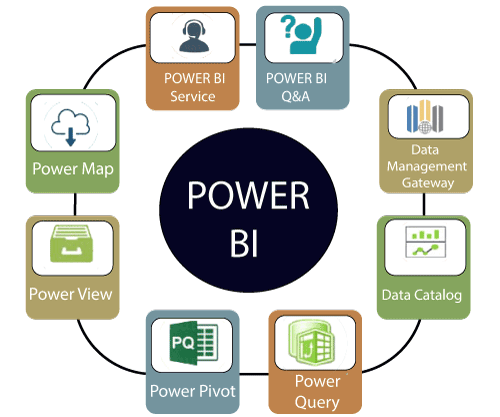
1. Power Query: It is used to access, search, and transform public and internal data sources.
2. Power Pivot: Power pivot is used in data modeling for in-memory analytics.
3. Power View: By using the power view, you can analyze, visualize, and display the data as an interactive data visualization.
4. Power Map: It brings the data to life with interactive geographical visualization.
5. Power BI Service: You can share workbooks and data views which are restored from on-premises and cloud-based data sources.
6. Power BI Q&A: You can ask any questions and get an immediate response with the natural language query.
7. Data Management Gateway: You get periodic data refreshers, expose tables, and view data feeds.
8. Data Catalog: By using the data catalog, you can quickly discover and reuse the queries.
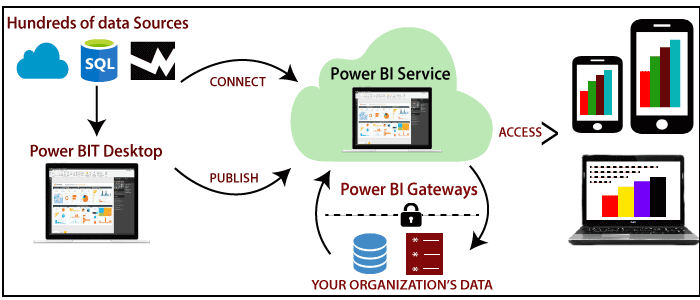
Power BI Architecture
The architecture of Power BI is shown as below:
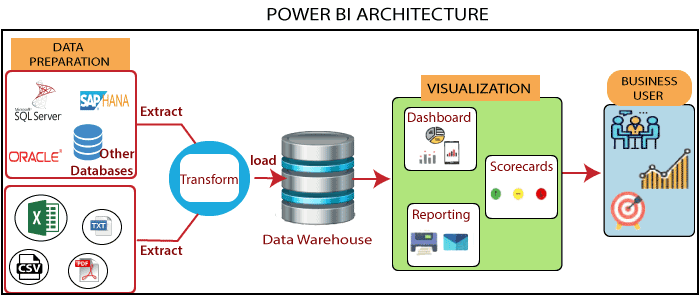
Power BI architecture has three phases. The first two phases use ETL (extract, transform, and load) process to handle the data.
- Data Integration: An organization needs to deal with the data that comes from different sources.
First, extract the data from different sources which can be your separate database, servers, etc.
Then the data is integrated into a standard format and stored at a common area that’s called staging area. - Data Processing: Still, the integrated data is not ready for visualization because the data needs processing before it can be presented. This data is pre-processed.
For example, the missing values or redundant values will be removed from the data sets.
After that, the business rules will be applied to the data, and it transforms into presentable data.
Then this data will be loaded into the data warehouse. - Data presentation: Once the data is loaded and processed, then it can be visualized much better with the use of various visualization that Power BI offers.
By using of dashboard and reports, we represent the data more intuitively.
These visual reports help business end-users to take business decision based on the insights.
Power BI Tools
Here are some essential tools of Power BI, as shown below:

- Power BI Desktop: It is a primary authoring and publishing tool. Power BI users and developers use it to create brand new models and reports.
Power BI Desktop tool is available at free of cost. - Power BI Service: The Power BI data modules, dashboards, and reports are hosted in the online software as a service (SaaS). Sharing, administration, and collaboration happen in the cloud.
Power BI Service tool is available at the pro license, and the user has to pay $10 per month. - Power BI Data Gateway: It works as the bridge between the Power BI service on-premises data sources such as Import, Direct Query, and Live Query. BI Admin installs Power BI.
- Power BI Report Server: It hosts paging reports, mobile reports, KPIs, and Power BI desktop reports. It requires updates in every four months and managed by the IT team.
- Power BI Mobile Apps: It is available for Android, iOS, and Windows. Microsoft Intune manages it by using this tool. You can view reports and dashboards on the Power BI Service Report Server.
Power BI Advantages
Here are some advantages of Power BI, as shown below:

1. Secure Report Publishing: You can automate setup data refresh and publish reports that allowing all the users to avail the latest information.
2. No Memory and Speed Constraints: To Shift an existing BI system into a powerful cloud environment with Power BI embedded eliminates memory. Speed constraints ensure that data is quickly retrievable and analyzed.
3. No Specialized Technical Support required: The Power BI provides quick inquiry and analysis without the need for specialized technical support. It also supports a powerful natural language interface and the use of intuitive graphical designer tools.
4. Simple to Use: Power BI is simple to use. Users can easily find it only on behalf of a short learning curve.
5. Constant innovation: The Power BI product is updated in every month with new functions and features.
6. Rich, personalized dashboard: The crowning feature of Power BI is the information dashboards that can be customized to meet the exact need of any enterprise. You can easily embed the dashboards, and BI reports in the applications to provide a unified user experience.
Power BI Disadvantages
Here are some disadvantages of Power BI, as shown below:
- Dashboards and reports are only shared with the users who are having the same email domains.
- Power BI will not merge imported data that is accessed from real-time connections.
- Power BI only accepts the file size maximum 250 Mb and the zip file which is compressed by the data of the x-velocity in-memory database.
- Dashboard never accepts or pass user, account, or any other entity parameters.
- Very few data sources permit real-time connections to Power BI reports and dashboards.
Download and Install Power BI Desktop
Here are some requirements of the system to download the Power BI Desktop:
- Window 7, window 8, window 8.1, window 10, and windows server 2008 R2, windows server 2012, windows server 2012 R2.
- It requires internet explorer 9 or higher.
- Power BI Desktop is available for both 32 bit and 64-bit platforms.
Let’s see the downloading process of the Power BI Desktop step by step:
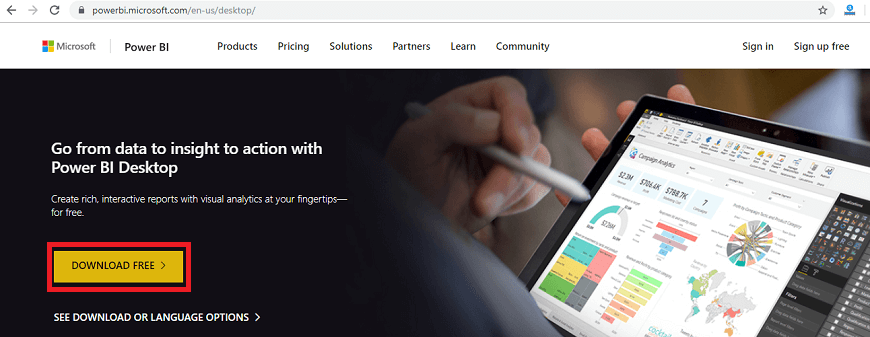
Step 1: Click on the below link to directly download Power BI Desktop. https://powerbi.microsoft.com/en-us/desktop/
Step 2: Then click on the Download Free button.
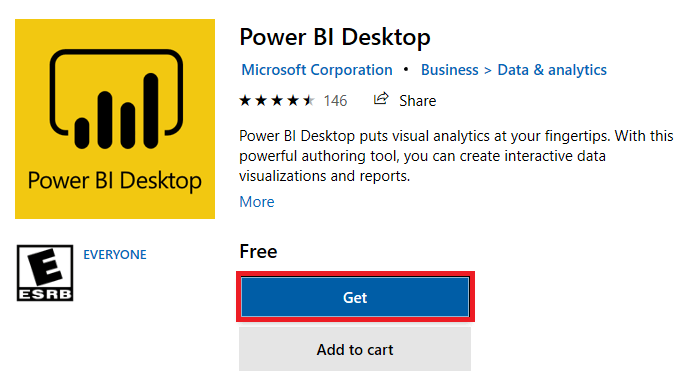
Step 3: Now, you will redirect to a Microsoft Store and then select the Get button.
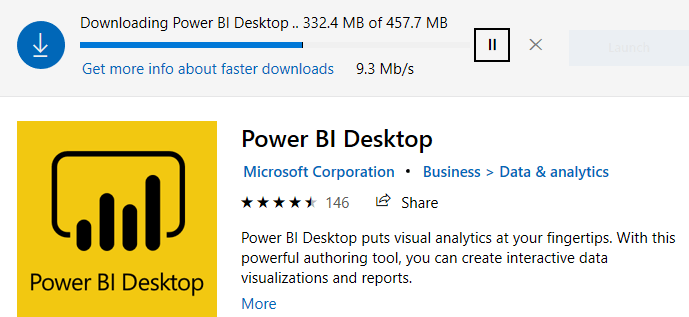
Step 4: Click on the Install button.
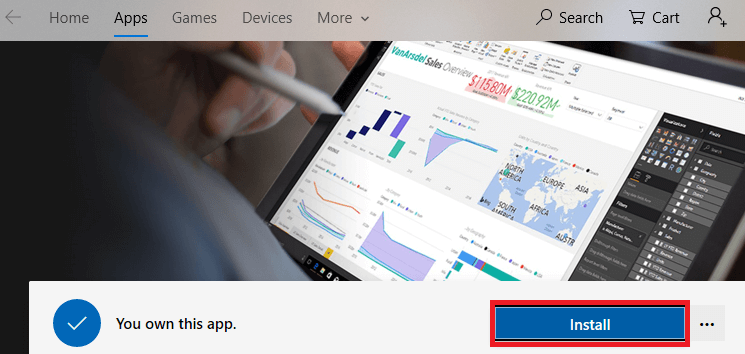
You can see the progress status of the Power BI Desktop on the screen.
Step 5: You can see “welcome to Power BI Desktop” screen and then register yourself on the desktop.

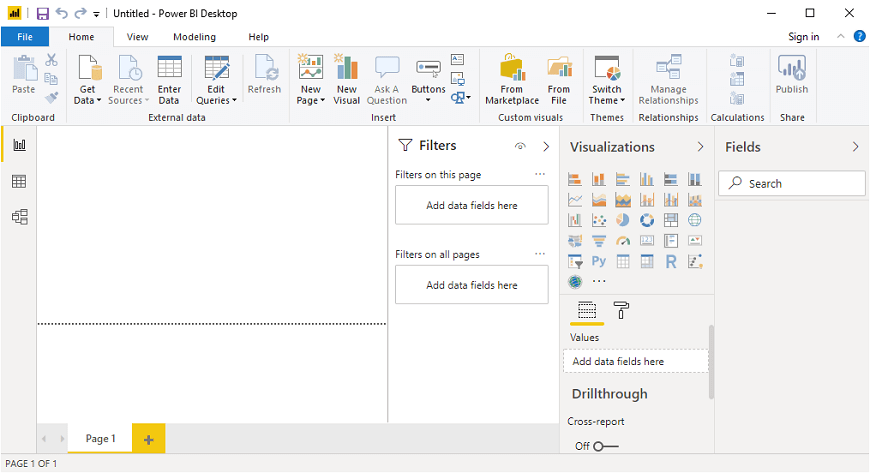
Step 6: When you run the Power BI desktop, it displayed the home page or welcome screen.
Power BI Dashboard
Power BI dashboard is a single page, also called a canvas that uses visualization to tell the story. It is limited to one page; therefore, a well-designed dashboard contains only the most essential elements of that story.
The visualizations visible on the dashboard are known as tiles. These tiles are pinned to the dashboard from reports. The visualizations on a dashboard come from reports, and each report is based on one data set.
A dashboard can combine on-premises and cloud-born data. And they are providing a consolidated view regardless of where the data lies.
Creating Dashboard in Power BI
We need to import one sample datasets of the Power BI and use it to create a new dashboard.
For example, suppose a sample such as Procurement Analysis. This sample is an excel workbook with two PowerView sheets.
When Power BI imports the workbook, it adds a dataset and a report to the workspace. Let’s see step by step.
Step 1: Open the Power BI Desktop and click on the File pane.
Step 2: Go to the Import option.
Step 3: And select the Excel dataset file to import the file.

Step 4: Select the procurement analysis sample file.
Step 5: And click on the Open button.

Step 6: For the exercise, select the Start button.
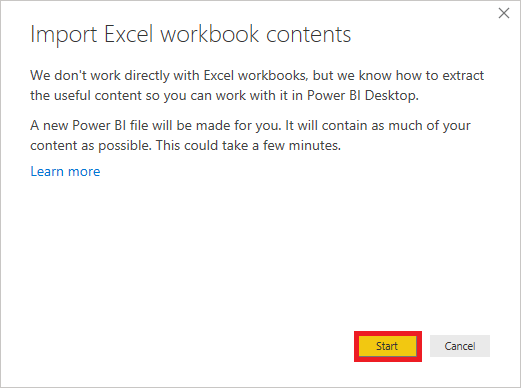
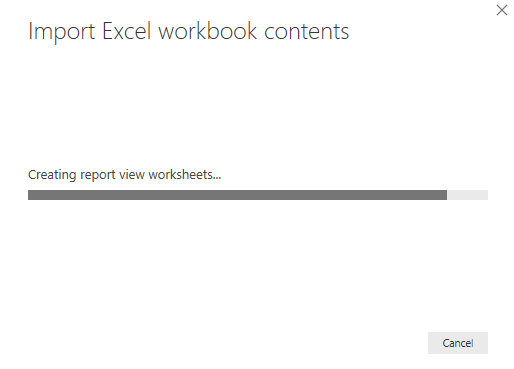
It starts import excel workbook and creating report view worksheets shown in the below screenshot.
Step 7: When the completed message appears, then select the Close button to dismiss it.

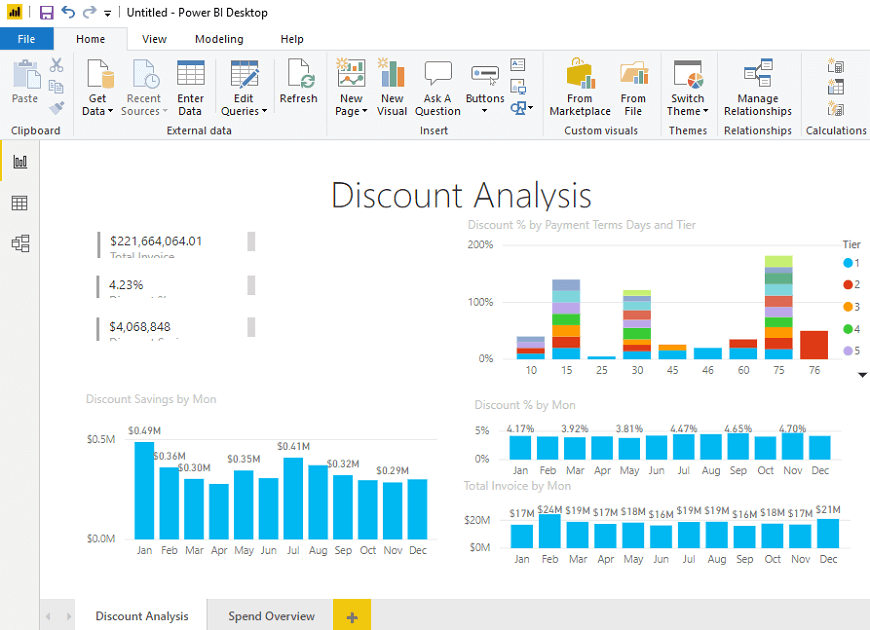
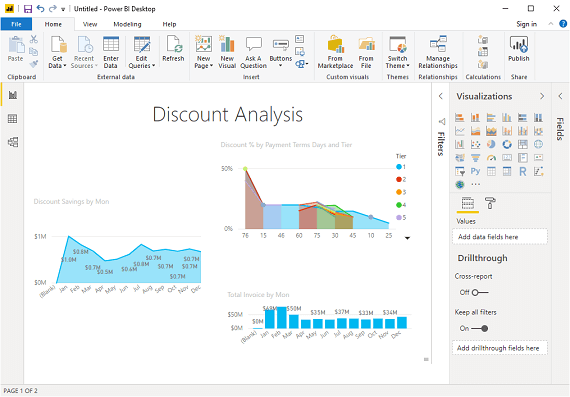
In the below screenshot, you can see the discount analysis of the imported dataset in the form of tiles.
Power BI Reports
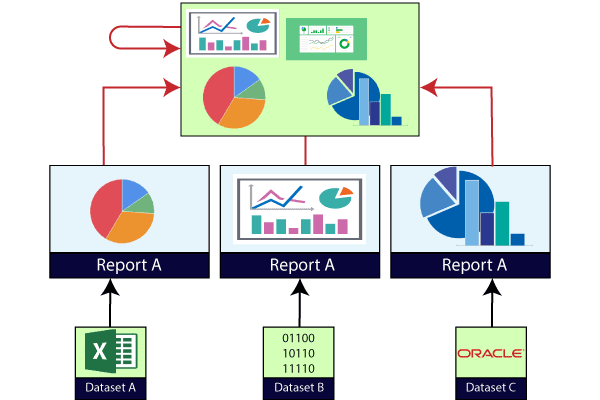
A Power BI report is a multi-perspective view into the dataset, with visualizations which represent different findings and insights from that dataset.
A report can have a single visualization or multiple visualizations. The visualizations in a report represent something like a dashboard does but serve a different purpose.
These visualizations are not static. These are highly interactive & highly customizable visualizations which update, as the underlying data changes. You can add and remove the data, change visualization types, and apply filters in your model to discover insights.
Difference between Dashboards and Reports
Dashboard and reports both terms are used interchangeably, but they are not synonymous. The below table compares the dashboard with the reports, such as:
| Capabilities | Dashboards | Reports |
|---|---|---|
| Pages | It has only one page. | It can have one or more pages. |
| Data Sources | It has one or more reports and datasets per dashboard. | It has only a single dataset per report. |
| Pinning | It can pin existing visualizations only from the current dashboard to your other dashboards. | It can pin visualizations to any of the dashboards. And also can pin entire report pages to any of the dashboards. |
| Filtering | It can’t filter or slice. | It has many different ways to filter, highlight, and slice. |
| Feature | It can set one dashboard as the featured dashboard. | It cannot create a feature report. |
| Set alerts | No | Yes, it can set alerts. |
| Subscribe | We can’t subscribe to a dashboard. | We can subscribe to report pages. |
| Available in Power BI desktop | No | Yes, it can create and view reports in desktop. |
| Change visualization type | No, if a report owner changes the visualization type in the report, the pinned visualization on the dashboard does not update. | Yes, it can change the visualization type. |
Power BI Data Sources
Power BI Desktop and Power BI Services support a large range of data sources. Click on the Get Data button, and it shows you all the available data connections. You can connect to different Flat files, Azure cloud, SQL database, and Web platforms, also such as Google Analytics, Facebook, and Salesforce objects. It includes an ODBC connection to connect to other ODBC data sources.
Here are the available data sources in Power BI, as shown below:
- SQL Database
- Flat Files
- Blank Query
- OData Feed
- Azure Cloud Platform
- Online Services
- Oracle database
- IBM Db2 database
- IBM Netezza
- IBM Informix database (Beta)
- Other data sources such as Exchange, Hadoop, or active directory
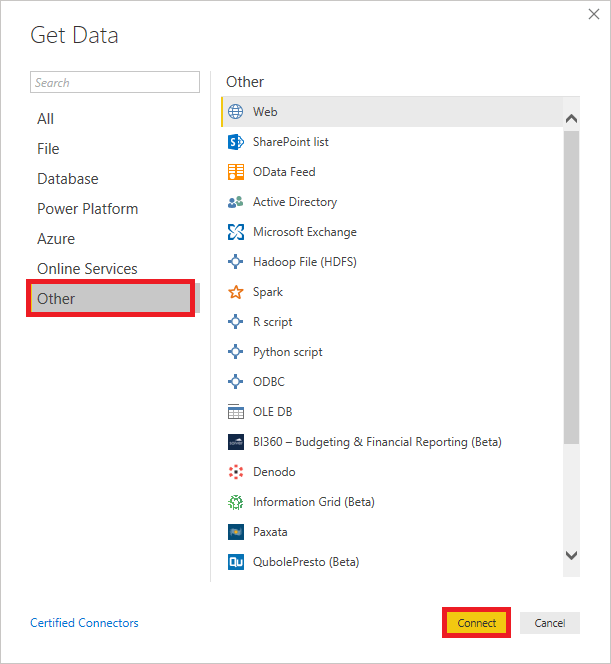
To connect data in Power BI Desktop, you need to click on the Get Data button in the main screen. First, it shows you the most common data sources. Then click on the More option to see a full available list of the data sources.
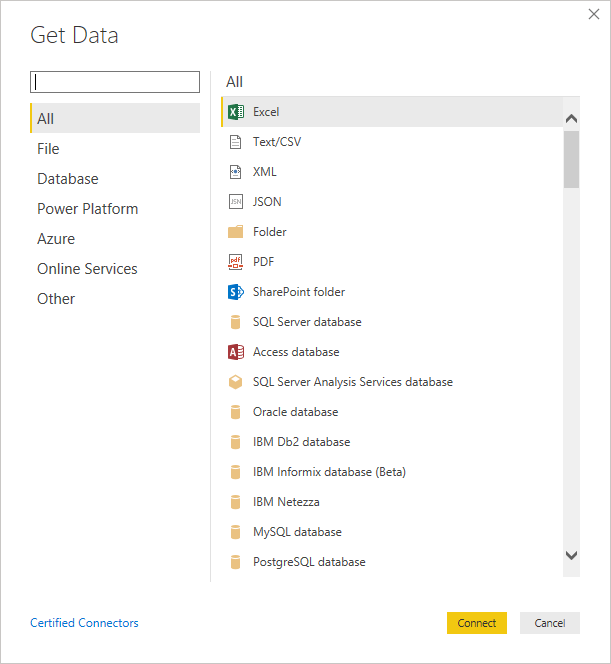
On the left side, it shows a category of all the available data sources. You also have an option to perform search operation at the top.
Let’s see all the listed data sources in detail:
1. All
In this category, you can see all the available data sources of the Power BI desktop.
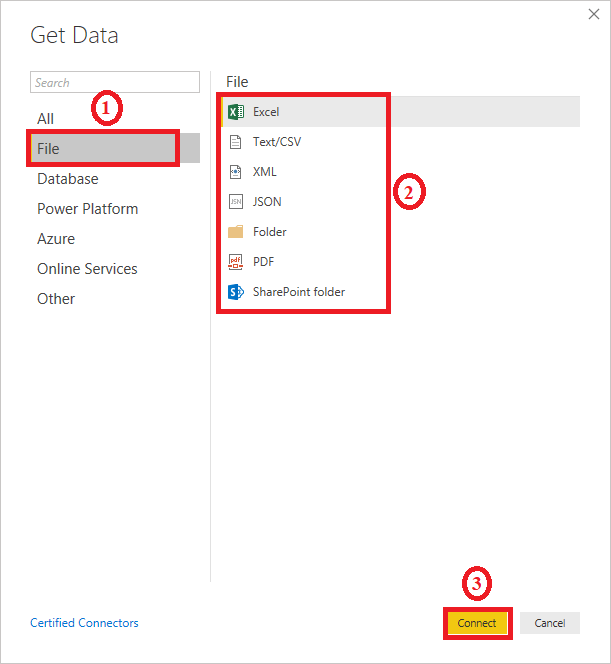
2. File
When you click on the File option, it shows you all the flat files supported in Power BI desktop. Select any file type from the list and click on the Connect button to connect that file.
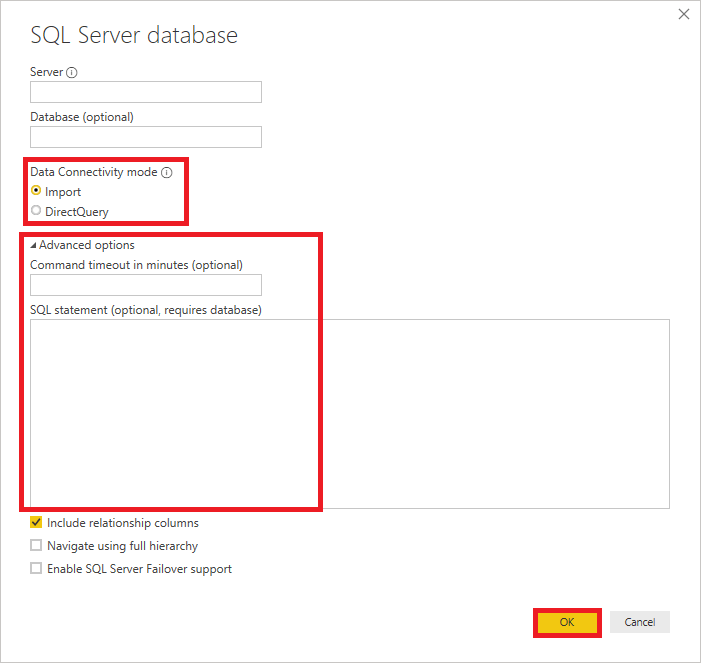
3. Database
When you click on the Database option, it shows you the list of all the database connections that you can connect to any database.

You need to pass the server name, user name, and password to connect. Also, you can connect via a direct SQL query using the Advanced option. You can also select connectivity mode – Import or DirectQuery.
Import: Import method allows to perform data transformations and manipulation. When you publish the data to PBI service (limit 1 GB), it consumes and pushes data into Power BI Azure backend and data can be refreshed up to 8 times a day and a schedule can be set up for data refresh.
DirectQuery: It limits the option of data manipulation, and the data stays in the SQL database. The DirectQuery is live, and there is no need to schedule refresh as in the Import method.
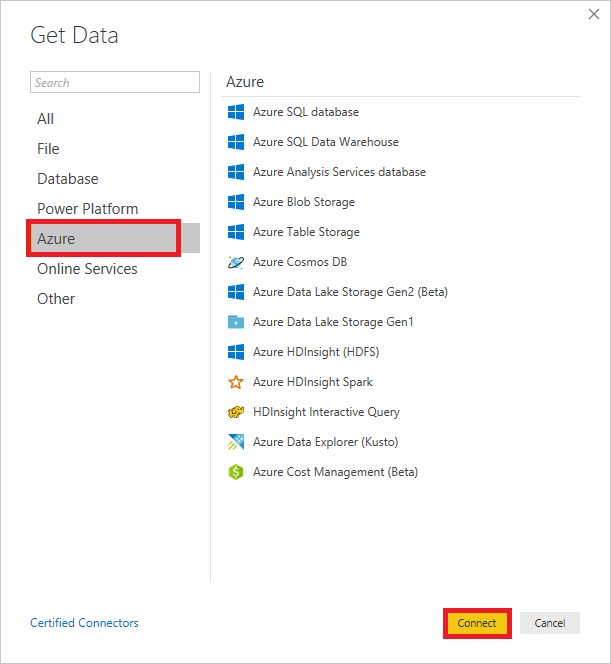
4. Azure
Using the Azure option, you can connect with the database in the Azure cloud. Below screenshot shows you the various options available under the Azure category.
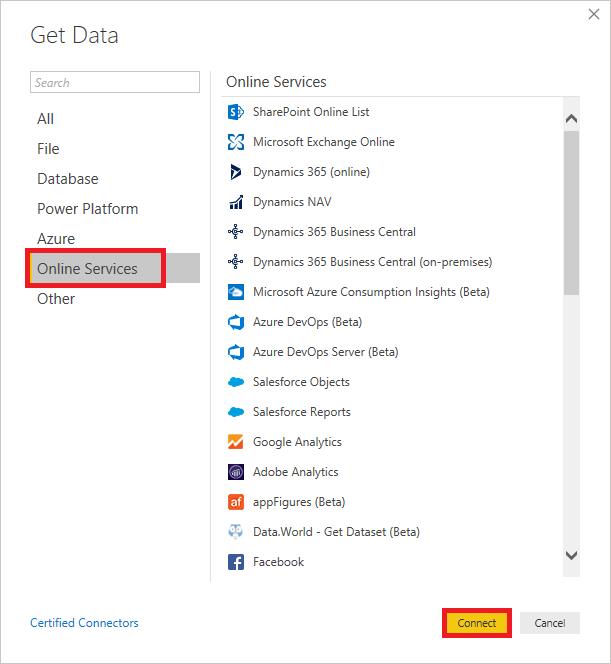
5. Online Services
The Power BI also allows you to connect to different online services such as Exchange, Salesforce, Google Analytics, and Facebook.
Following screenshots showed the various options available under Online Services.
6. Other
Below screenshot shows the various options available under other categories.
Power BI Embedded
The Power BI service (SaaS) and the Power BI Embedded service in Azure (PaaS) have APIs for embedding the dashboard and reports. When you are embedding the content, this gives you access to the latest Power BI features such as dashboards, gateways, and app workspaces.
There are two scenarios for embedding Power BI content:
- Embedding for organization’s users
(Who have Power BI license) It allows us to extend the Power BI service. It requires your application’s user sign in to the Power BI service to view the content.
After sign in, they only have access to dashboards and reports that they own or someone shared with them in the Power BI service. - Embedding for users and customers
It allows you to embed the dashboards and reports for users who don’t have a Power BI account. This type of embedding is also known as Power BI embedded.

Power BI Embedded has benefits for an ISV, their developers, and the customers. For example, an ISV can start creating the visuals for free with Power BI Desktop. By minimizing the visual analytic development efforts, ISVs achieve faster time to market and stand out from the competitors with differentiated data experiences. Also, ISVs can opt to charge a premium for the additional value they create with embedded analytics.
With Power BI Embedded, your customers don’t need to know anything about Power BI. You can use two different methods to create an embedded application:
- Power BI Pro account
- Service principle
The Power BI Pro account acts as the master account of your applications (think of it as a proxy account). This account allows generating embed tokens which provide access to your application’s Power BI dashboards and reports.
Service principle can embed Power BI content into an application using an app-only token. It also allows generating embed tokens which provide access to your application’s Power BI dashboards and reports.
Note: While embedding requires the Power BI service, customers do not need to have a Power BI account to view the application embedded content.
Power BI Gateway
Power BI Gateway is a software which is required to access data situated in an on-premises network. Gateway plays a role like as a gatekeeper for the on-premises data source. If anyone wants to access on-premises data from the cloud or web-based app, that request goes through the gateway. The gateway attends all the connection requests, and access is granted based on their authentication and requirements.
Gateway does not transfer the data from the on-premises source to the client platform. But it directly connects that platform to the on-premises data source. The client can directly access the data from its on-premises location to use it for making a dashboard, reports, and data analysis.
Generally, a gateway is used to facilitate the connection between a single data source and multiple data source to the on-premises data source.
Types of the Power BI Gateway
There are two types of Power BI gateways:
- Standard Mode
- Personal Mode
On-premises data gateway (standard mode)
On-premises data gateway allows connection with the multiple on-premises data sources for more than one user. You can use the data in Power BI, Azure Logic Apps, Azure Analysis Services, PowerApps, Microsoft Flow, etc.
You can establish direct connections to multiple data sources only installing this type of data gateway. This data gateway is very helpful for complex scenarios where multiple users need to access various data sources.
On-premises data gateway (personal mode)
The particular mode of on-premises data gateway allows only one user to connect to different data sources. It is helpful when only one person needs to access the data sources. To create reports and the dashboards using Power BI, the user cannot share its access privilege with other users.

Power BI Gateway Architecture
Power BI gateway functions play a role as a mediator between the cloud services and on-premises data sources. The On-premises data gateways run as a Windows service. This Windows service gets registered with the Gateway Cloud Service through Azure Service Bus.
The architecture and working of the data gateway with the help of the diagram given below:
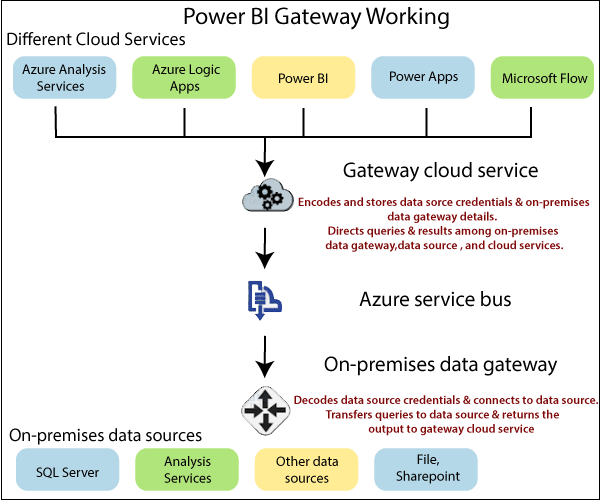
Power BI gateway architecture is divided into three parts:
1. Cloud services
2. Gateway services
3. On-premises data sources
- According to Power BI, a cloud service creates a query which requires data from an on-premises data source.
- This query from cloud services goes to the gateway cloud service with encrypted credentials.
- The gateway cloud services process and analyze the request and then forward it to the Azure service bus. You don’t need to configure azure service bus separately because Power BI manages it by default.
- The Azure service bus keeps all the requests to be sent forward to the on-premises data gateway. The on-premises data gateway decrypted credentials for the data source and connect the user to the data source.
- The on-premises data gateway forwards the query sent from the cloud service to the on-premises data source.
- The data query is executed at a data source that can be SQL Server, SharePoint, files, SSAS, etc.
- Result of the query is returned to On-premises data gateway by the data source. The On-premises data gateway sends the result back to the cloud service via Azure Service Bus.
Building Blocks of Power BI
There are five building blocks, such as Visualization, Reports, Dashboards, Datasets, and Tiles.
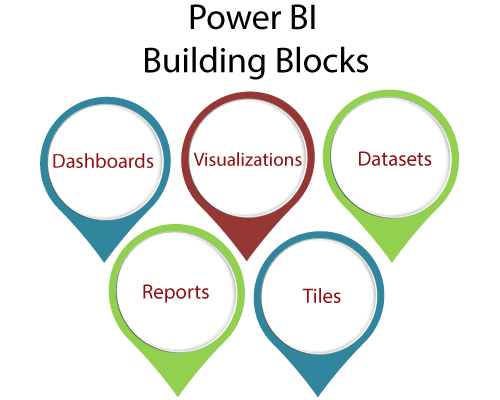
- Visualization: The visualization is a type of chart or visuals that built by the Power BI designers. These visuals display the data from the datasets and report.
For example, line graph, pie chart, bar charts, and other graphical representation of the source data on a top geographical map, etc. - Reports: A report is a collection of one or more pages of interactive visuals, text, and graphics that together make a single report.
For example, state, city report, sales by country, profit by-products report, logistic performance report, etc. - Dashboards: Dashboard is a single layer presentation of multiple visualizations with interactive visuals, text, and graphics. A dashboard collects the most important metrics, on one screen, to tell a story or answer a question. The dashboard content comes from one or more datasets and one or more reports.
For example, pie charts, bar charts, and geographical maps. - Datasets: The dataset is a collection of data which is used to create its visualization in Power BI.
For example, Oracle or SQL servers tables and excel sheets. - Tiles: The tile is a single visualization in the report or on the dashboards.
For example, the pie chart in reports or dashboard.
Power BI Report Server
Power BI Report Server is an on-premises report server with a web portal in which you display and manage reports and KPIs. Along with it come to the tools to create Power BI reports, mobile reports, paginated reports, and KPIs. Users can access those reports in different ways: viewing them on a web browser on any device, or as an email in their inbox.

Power BI Report Server is a specific edition of SQL Server Reporting Services that can host Power BI reports. For running Power BI Report Server, you don?t need to have SQL Server installation disk; the Report Server already comes with its setup files. You can download set up files. Power BI report server can host Power BI Reports as well as Reporting Services (SSRS) Reports.
With Power BI report server, there will be an instance of Power BI Desktop installation. The Power BI Desktop edition that comes with the report server should be used to create Power BI reports. Otherwise, reports cannot be hosted on the report server. The Power BI Desktop report server edition is regularly updated, and its experience will be very similar to the Power BI Desktop.
You can download the latest edition of Power BI report server from the below link. https://powerbi.microsoft.com/en-us/report-server/
You need two installation items such as Power BI report server and Power BI desktop report server edition (in 32 bit and 64-bit versions).
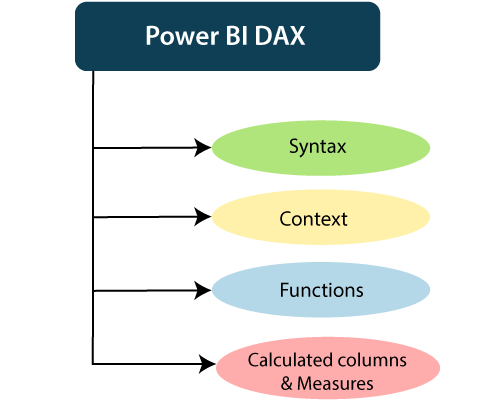
Power BI DAX
DAX (Data Analysis Expressions) is a formula expression language. It can be used in different BI and visualization tools. DAX is also known as function language in which the full code is kept inside a function. DAX programming formula contains two data types such as Numeric and Other.
Numeric includes currency, integers, and decimals, where Other includes string and a binary object.
How does it work?
For understanding the Power BI DAX, it has main three fundamental concepts such as:
- Syntax
- Context
- Functions
1. Syntax
the syntax consists of various components that make up a formula.
- Total Sales is the measure name.
- The equal sign (=) operator indicates the beginning of the formula.
- The DAX function SUM adds up all the numbers in the Sales[SalesAmount] column.
- Parentheses () surround an expression containing one or more arguments. And all function requires at least one argument. An argument passes a value to a function.
- The reference table Sales.
- The referenced column [SalesAmount] in the Sales table. With this argument, the SUM function knows on which column to aggregate a SUM.
2. Context
Context is one of the essential concepts of DAX. It is categorized into two parts; Row context and Filter context.
The Row-Context is the easiest thought of as the current row. It applies whenever a formula has a function which uses the filters to identify a single row in a table.
The Filter context is a little more challenging to understand than the Row context. You can most easily think of the Filter-Context as one or more filters applied in a calculation. The Filter-Context doesn’t exist in the Row-context’s stead. Instead, it uses in addition to the former. Look at the following DAX formula.
3. Functions
Functions are predefined and ordered formula. They can perform calculations using arguments passed on to them. These arguments can be text, numbers, logical values, or other functions.
Types of Functions
Here are some important DAX functions:
1. Aggregate Functions
- MIN
This DAX function returns the minimum numeric value in a column, or between the two scalar expressions.
Syntax
- MAX
This DAX function returns the maximum value in a column, including any logical values and numbers represented as text.
Syntax
- AVERAGE
This DAX function returns the arithmetic mean of the values in a column.
Syntax
- SUM
This DAX function adds all the numbers in a column.
Syntax
2. Count Function
- COUNT
This DAX function is used to return the count of items in a column. If there are multiple numbers of the same thing, this function will count it as separate items and not a single item.
Syntax
- DISTINCTCOUNT
This DAX function is used to return the distinct count of items in a column. If there are multiple numbers of the same thing, this function will count it as a single item.
Syntax
3. Date time Function
- DATE
This DAX function returns the specified date in Date-Time format.
Syntax
- HOUR
This DAX function returns the specified hour as a number from 0 to 23 (12:00 A.M. to 11:00 P.M.).
Syntax
4. Logical Function
- AND
This DAX function performs logical AND(conjunction) on two expressions. For AND to return true, both conditions specified have to be fulfilled.
Syntax
- OR
This DAX function performs logical OR(disjunction) on two expressions. For OR to return true, either of the two conditions specified has to be fulfilled.
Syntax
- NOT
This DAX function performs logical NOT (negation) on given expression.
Syntax
5. Text function
- CONCATENATE
This DAX function joins two text strings into one text string.
Syntax
- FIXED
This DAX function rounds a number to the specified number of decimals and returns the result as text.
Syntax
- REPLACE
This DAX function replaces part of a text string, based on the number of characters you specify, with a different text string.
Syntax
Calculated Columns and Measures
The Power BI DAX formulae are used in calculations, in Measures and Calculated Columns.
Calculated Columns
When you create a data model on the Power BI Desktop, you can extend a table by creating new columns. The content of the columns is defined by a DAX expression, evaluated row by row or in the context of the current row across that table.
Measures
There is another way of defining calculations in a DAX model, useful if you need to operate on aggregate values instead of on a row-by-row basis. These calculations are measures. One of the requirements of DAX is a measure that needs to be defined in a table. However, the action does not belong to the table. So, you can move a measure from one table to another one without losing its functionality.
Who Uses Power BI?
Some professionals who use Power BI tool are listed below:
- Business and data analyst
- Project and portfolio manager
- IT team and IT professionals
- Developers and database administrator
- Data scientist
- Consumer for end-user report


