
How To Calculate P Value In Excel
P-value is a probability that the given result is due to chance.
The correct interpretation of the statistical significance score P tells about the probability of getting the difference we see in our study, or even greater if the null hypothesis is actually true.
How to calculate p value in Excel?
To calculate p-value use Data Analysis Toolpak add-in.
Here's how to add the analysis toolpak on excel.
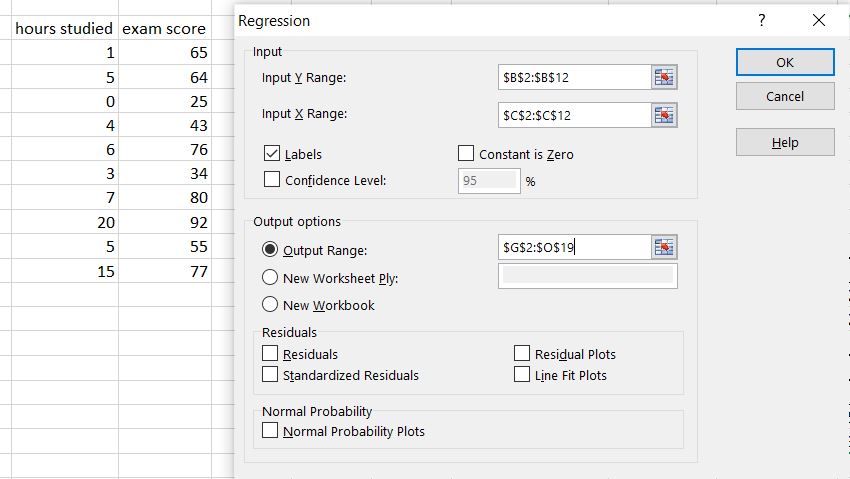
First prepare your data. I have two sets of value how many hours students studied to the exam and their exam scores.
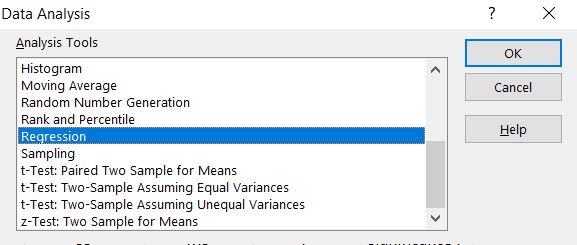
Click Data Analysis button and choose Regression.
Put input values. In my example Y Range are hours studied and X Range is for exam scores.
As and Output Range choose where would you like to put results of Regression analysis in your sheet.
Here there are results of regression analysis.
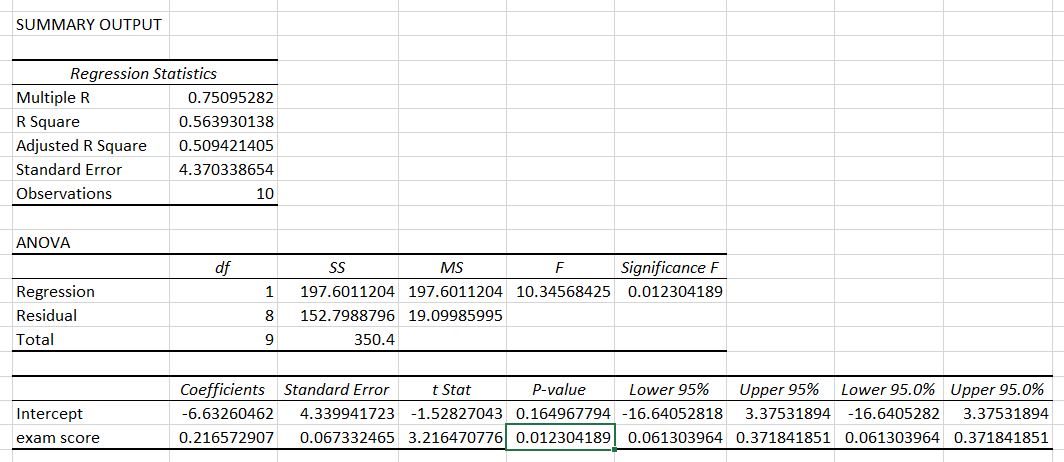
P value of exam score is exactly 0.012304189.
You got also other values like Standard Error and Anova test.
How to interpret p value?
See the p value:
- Significant: <=0.05
- Marginally significant: <=0.1
- Insignificant: >0.1
In my example it is significant because 0.012304189 is less than 0.05. It was worth to study hard to get better exam score.
Template
Further reading:
How to calculate t value?
Basic concepts
Getting started with Excel
Cell References


