Excel FORECAST.ETS.SEASONALITY function
Want to forecast your future data parameters quickly and perfectly? Kudos to Excel for introducing powerful inbuilt advanced functions and saving 80% time for you. One such function is Excel FORECAST.ETS.SEASONALITY function.
In this tutorial, you will discover the definition of FORECAST.ETS.SEASONALITY function, its syntax, parameter, error type and reasons, and real-time examples to understand how this formula calculates the length of a recurring pattern in the specified timeline.
What is FORECAST.ETS.SEASONALITY function?
“The FORECAST.ETS.SEASONALITY function is an inbuilt function that calculates the length of a recurring pattern in a given timeline. This function is mostly used with FORECAST.ETS because both functions use the same algorithm to detect seasonality.“
In simple terms, the FORECAST.ETS.SEASONALITY function is used to calculate the season length for numeric data such as sales, inventory, expenses, etc., displaying a seasonal pattern. If Excel cannot detect any pattern, the FORECAST.ETS.SEASONALITY function returns zero.
Syntax
Parameters
Values (required) – This argument signifies a range or array of historical data for which you want to predict future values.
Timeline (required) – This parameter represents an array of dates/times or independent numeric values with a constant step between them.
Data completion (optional) – This parameter accounts for missing points.
- If the user supplies 1 or this parameter is omitted, the function fills in the missing points as the average of the neighbouring points (liner interpolation).
- If user supplies 0, this function considers the missing points as zeros.
Aggregation (optional)- This parameter specifies how the algorithm should aggregate values that have the same timestamp.
Since it is an optional parameter, it could be omitted as well. But if supplied, this parameter argument can be any integer between 1 and 7 indicating the following:
| [aggregation] | Aggregation Method |
|---|---|
| 1 (or omitted) | It represents Average |
| 2 | It represents Count |
| 3 | It represents Counta |
| 4 | It represents Max |
| 5 | It represents Median |
| 6 | It represents Min |
| 7 | It represents Sum |
Note: It is better to perform aggregation before using FORECAST.ETS.SEASONALITY to make results as accurate as possible.
Return
The Excel FORECAST.ETS.SEASONALITY function returns the length in time of a seasonal pattern based on existing values and a timeline.
Excel FORECAST.ETS.SEASONALITY not working
The FORECAST.ETS.SEASONALITY function will return errors as shown below:
- This function will return an output as zero, if it is not able to detect any repetitive seasonal pattern.
- The seasonal pattern returned by the FORECAST.ETS.SEASONALITY function is exactly the same as that is calculated automatically by the FORECAST.ETS function (the argument “seasonality” is defined as 1);
- This function returns #VALUE!, if any of the cases happen:
- The specified argument seasonality is not numeric
- The parameter data_completion is not numeric
- the aggregation parameter is not numeric
- This function returns #N/A error if values and timeline are not the same size
- This function returns #NUM error, if any of the cases happen:
- Consistent step cannot be determined in timeline
- All timeline values are the same
- The value for data_completion is not 0 or 1
- The value for aggregation is not within 1-7
Examples
Example 1: Using the FORECAST.ETS. SEASONALITY function calculate the length of the seasonal trend.
As you can see in the below table, we are given a monthly sales table for 2020, and based on the previous value.

To compute the seasonal length of the predicted sales value using the Excel FORECAST.ETS.SEASONALITY () function follow the below-given steps:
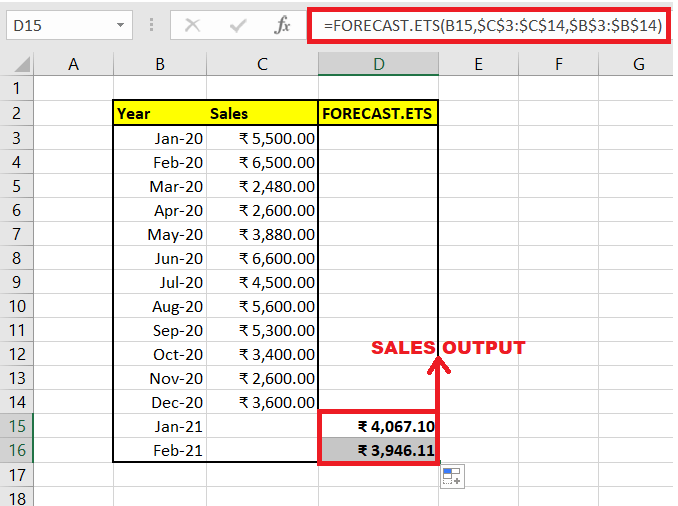
Step 1: Predict the sales using FORECAST.ETS
The function FORECAST.ETS is tied with FORECAST.ETS.SEASONALITY function because both the function use the same algorithm and it helps to predict the forecast accuracy. Therefore, we will predict the sales revenue for the 2 months and later using FORECAST.ETS.SEASONALITY function will calculate the length of the seasonal trend.
Use the below given formula to calculate the future values for the given data set.
=FORECAST.ETS(B15,$C$3:$C$14,$B$3:$B$14,1,1,1)
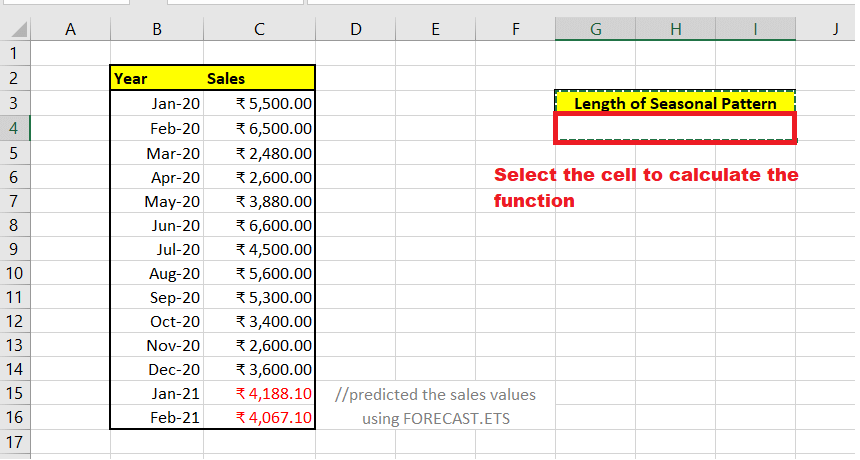
STEP 3: Select a cell
Once we have predicted the sales output, next we will select a cell to compute the seasonal length for the given data.
STEP 2: Type the FORECAST.ETS.SEASONALITY function
To compute the length of a recurring pattern in a given timeline, we will use the inbuilt FORECAST.ETS.SEASONALITY() function. Therefore, start typing the function with the equal to (=) symbol followed by the pre-defined FORECAST.ETS. SEASONALITY function.
Our formula will become: =FORECAST.ETS.SEASONALITY(
STEP 3: Supply the Parameters
- At first, this function will ask you to specify the ‘Value’ parameter. Here, we will specify an array of historical known values corresponding to an array of dates/times. The formula will be =FORECAST.ETS(B15,$C$3:$C$14,
- The next argument is Timeline. This parameter should contain independent array of dates/times. The formula will be =FORECAST.ETS(B15,$C$3:$C$14,$B$3:$B$14)
- The last 2 arguments of these functions are optional. Therefore, if you want you can omit them as well. Excel will use the following default value in its place:
- For the parameter Data completion, 1 will be supplied as default option so as to complete missing points as the average of the neighbouring points.
- In the Aggregation parameter, value 1 will be passed as a default option so it can aggregate multiple data values with the identical timestamp by using the AVERAGE function.
Therefore, the overall formula becomes:
=FORECAST.ETS.SEASONALITY($C$3:$C$16,$B$3:$B$16,1,1)

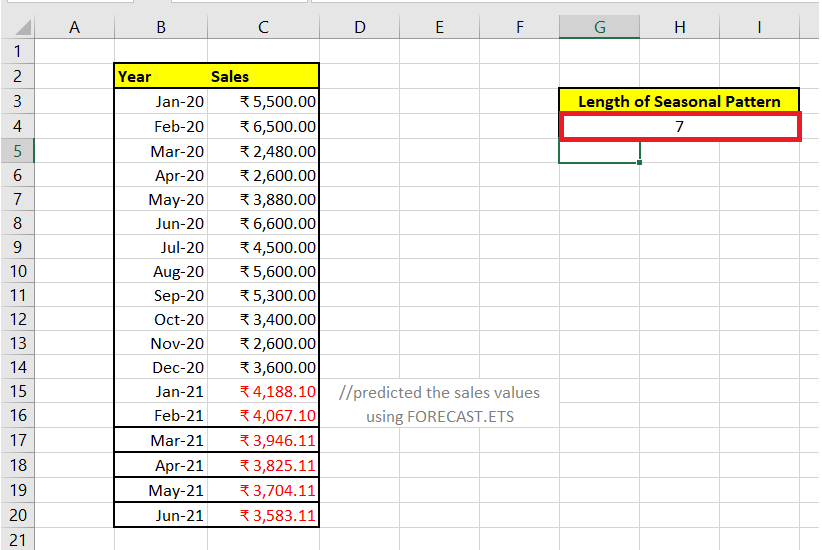
Step 4: The FORECAST.ETS.SEASONALITY function will return the output
As a result, the FORECAST.ETS.SEASONALITY function will calculate the season length for numeric sales data.
Since this function is not able to detect any pattern so it has returned zero.

Next, we have predicted some more data values using the FORECAST.ETS function. Now, this function has returned a seasonal value of 7, since now it can detect the pattern of the predicted sales data.
Refer to the below image: