
Growth Function in Excel
Growth is an indispensable part of every industry, and therefore, predicting exponential growth for any data set is a mandatory field for every business. What if I tell you that Microsoft Excel has mastered this domain. Yes, to help in financial and statistical analysis and predict revenue targets, MS Excel has introduced an inbuilt statistical function named Growth function.
In this tutorial, you will learn the Growth function, its syntax, parameters, points to remember, how this formula works, and various examples by using the Growth function to predict revenue targets and sales.
What is Growth Function?
“The inbuilt exponential growth function in Excel is a Statistical Function that returns the predictive exponential growth for a given set of data. For a given new value of x, it returns the predicted value of y.“
The Growth function in Excel helps in financial and statistical analysis; it helps to predict revenue targets, sales. It is also used in regression analysis in Excel, wherever the growth is calculated exponentially. This function fits an exponential curve to the data and returns the dependent value of y for the new value of x specified.
The GROWTH Function in Excel is represented by the below given relation:
y =b*m^x
Where, y =b* m^x represents an exponential curve wherein the value of y depends upon the value x, m represents the base with exponent x, and b represents the constant integer value.
The Exponential Growth function is very useful to determine the estimated growth when growth occurs exponentially. For example, when a microorganism increases exponentially in biology, the human population also grows exponentially. The stock prices and other financial figures also follow the exponential growth, so in these methods, one can use the Exponential growth function to represent the estimated growth of their stock figures.
Syntax
Parameters
Known_y’s (required): This parameter represents a set of y-values in the data set.
Known_x’s (optional): This parameter represents a set of x-values in the data set. The range value for known_x’s parameter should be the same as known_y’s values. If this argument is omitted, it is assumed that the given array (1,2,3,…) is of the same size as known_y’s parameter.
New_x’s (optional): This parameter represents the new value of x for which we want to calculate the predictive corresponding value. The New_x’s argument must include a column (or row) for each independent variable.
If this parameter omitted, the values of new_x’s array are expected to be the same known_x’s array. The Growth function will return the y values on exponential growth curve.
Const(optional): This parameter represents a logical value (either True or False) that determines whether the constant ‘b’ in the equation y = b * m^x should be forced to be equal to the integer 1 or not.
- If the parameter is TRUE or omitted, b is calculated normally.
- If the parameter const is FALSE, b is set equal to 1 and the m-values are adjusted such as the equation y = m^x is followed.
Growth Function – Things to Remember
While using Excel functions, we always have to be careful as a little mistake can throw an error. The same is applied to the excel growth formula. If we supply an incorrect syntax, we will get an incorrect output, or the function can even throw some errors. To prevent such errors, below are some useful points that one should keep in mind while using the Growth function:
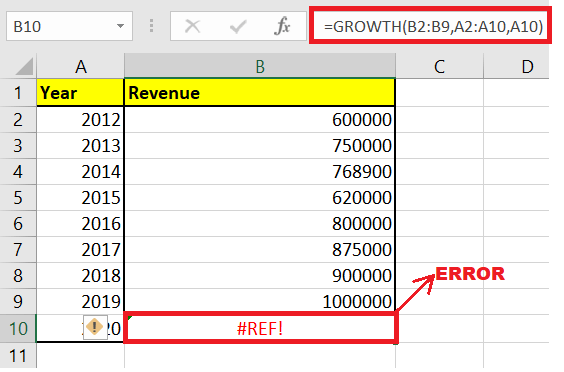
- This function may return the #REF! error, if the length of specified known_x’s array isn’t of the same length of known_y’s array.
- The Growth function can return the #NUM! error if any value of the specified known_y’s parameter is less than or equal to zero.
- The #VALUE! error occurs when in the function you supply a non-numeric or text value for the known_y’s, known_x’s or new_ x’s parameter.
- We often use a scatter chart for the specified dataset in growth function graphs rather than a line. We use the exponential option from the graph trend line option.
- The exponential Growth function is used as an array formula when multiple new values of y are to be calculated. Therefore, an array formula is achieved using the Crtl+ Shift+ Enter and not Enter.
Examples:
#Growth Example 1: Let’s assume we are given a range of list and now we want to figure out if sales of $15 million are possible or not for the next financial year.
In the question we are given the below details:
- For the Known_y’s parameter, we are given the revenue values.
- For the Known_x’s parameter, we are given the years for which sales revenue data are available.
- For the New_s’s argument, we are given the years for which we want to predict the sales revenue.
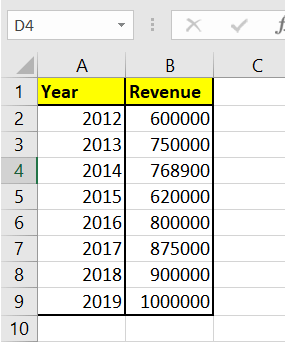
Suppose we are given the following data (mentioning the Year and Revenue):

The Excel Growth Function is a very useful function to calculate or forecast growth that occurs exponentially. Follow the below-given steps to estimate the predictive exponential growth and determine if sales of $15 million are possible or not using the Excel GROWTH () function:
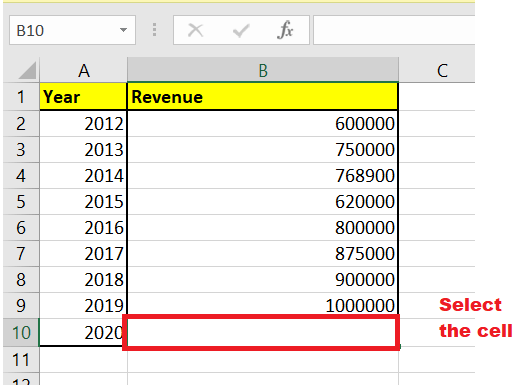
Step 1: Select a cell to calculate GROWTH
Place your cursor to a cell from where you want to fetch the output of the GROWTH() function. In our case, we have selected cell B10 of our spreadsheet.
Refer to the given below image:
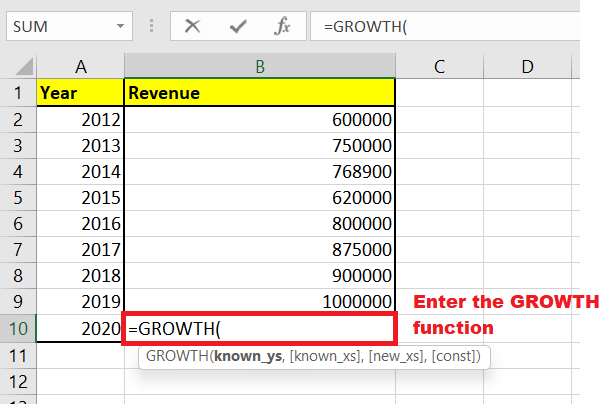
STEP 2: Enter the GROWTH function
In B10, we will start typing the function with the equal to (=) sign followed by the GROWTH function. So, our formula will become: = GROWTH(

STEP 3: Specify all the parameters
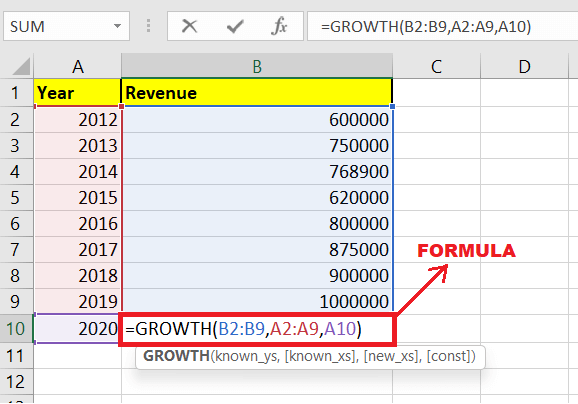
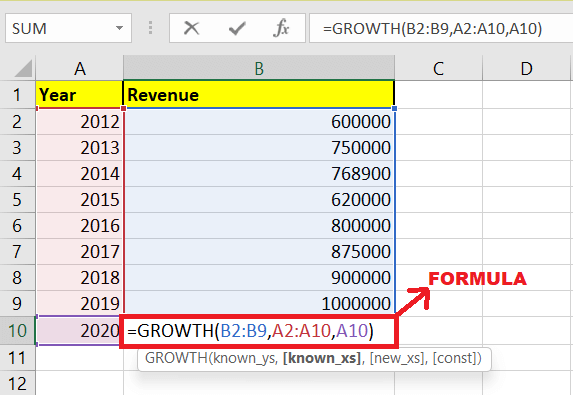
- At first, this function will ask you to specify the Known_y’s parameter wherein it we will enter a set of y-values. This parameter should contain all the values that refer the sales revenue. The formula will be = GROWTH(B2:B9,
- The next argument is Known_x’s. In this we will specify the year values. The formula will be = GROWTH(B2:B9,A2:A9,
- The next argument we will specify the New’s It new value of x for which we want to calculate the predictive corresponding value. Since we want to calculate the revenue of year 2020, therefore the formula will be =GROWTH(B2:B9,A2:A9,A10)
Step 4: The GROWTH function will return the output
As a result, the GROWTH function will return the exponential sales growth for the given data. You will have the following output:
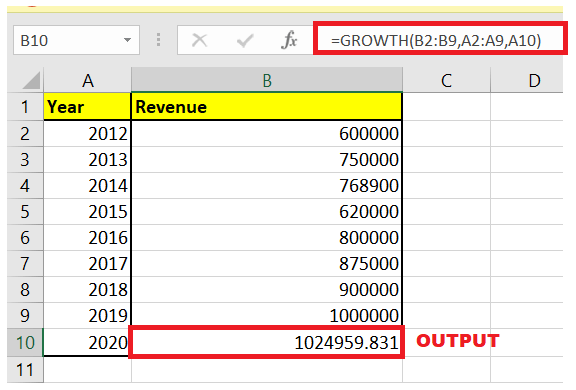
Since the output is 1024959.831, therefore, we can conclude that the sales revenue for the next financial year cannot be $15 million.
#GROWTH Example2: Example to demonstrate GROWTH not working.
We will continue using the same data set used in the above example. Let’s see what will happen if the length of specified known_x’s array isn’t of the same length of known_y’s array. Microsoft Excel won’t recognize this data since they are not in its valid format and an #ref error will be thrown. The data is shown below:
Follow the below-given steps to calculate the output of Growth function the length of specified known_x’s array isn’t of the same length of known_y’s array:
Step 1: Select a cell to calculate GROWTH
Place your cursor to a cell from where you want to fetch the output of the GROWTH() function. In our case, we have selected cell B10 of our spreadsheet.
Refer to the given below image:

STEP 2: Enter the GROWTH function
In B10, we will start typing the function with the equal to (=) sign followed by the GROWTH function. So, our formula will become: = GROWTH(
STEP 3: Specify all the parameters
- At first, this function will ask you to specify the Known_y’s The formula will be = GROWTH(B2:B9,
- The next argument is Known_x’s. In this we will specify the year values where the size will exceed by one more value. The formula will be = GROWTH(B2:B9,A2:A10,
- The next argument we will specify the New’s Since we want to calculate the revenue of year 2020, therefore the formula will be =GROWTH(B2:B9,A2:A9,A10)
Step 4: The GROWTH function will return the output
As a result, the GROWTH function will return the #REF error. For this function to work properly always ensure that the size of known_x’s array and the known_y’s array are exactly the same. You will have the following output:
Great! Now you have learnt to calculate the predictive exponential growth for a given set of data. Go ahead and give a try to this function.


