
Flow Chart Excel
MS Excel or Microsoft Excel is one of the powerful spreadsheet software designed by Microsoft company. It provides various features and functions by default. It is fairly popular spreadsheet software for visualizing data or adding relevant graphical elements, such as shapes, images, clip-arts, charts, etc.
The flowchart is a popular type of chart that is widely used in process-driven approaches. They are used within various programs or software, including Excel. However, there is no direct option to insert a flow chart like other typical Excel charts. But, there are ways to create the desired Structured Flow Chart in Excel. This article discusses the brief introduction of flow charts and the detailed step-by-step tutorial on easily inserting these charts in Excel.
What is a Flow Chart in Excel?
A flow chart (also written as Flowchart) is a diagram that depicts the steps of any process, task, or workflow. It typically helps display the relationships between various data points, giving clarity to our worksheet. A flow chart is also referred to as a Process Chart, Process Flowchart, Process Map, Process Flow Diagram, Functional Flowchart, etc.
The flow chart is easy to draw and understand by both technical and non-technical people. That is why it is widely seen in various fields to plan, study, or communicate complex processes in straightforward, easy-to-understand diagrams. These diagrams can be simple, hand-drawn structures to comprehensive computer-created structures illustrating relevant steps and directions of their execution.
The flow chart is one of the essential visualization tools used by programmers, engineers, system analysts, and many other managers. It is a means of communication for describing various tasks, including the following:
- Data Flows
- Document Workflows
- System Operation Flows
- Algorithms
The following image displays a simple flow chart diagram drawn in an Excel Sheet:

Common Elements and their uses in Flow Chart
The typical structure or standard in a flow chart concludes the directions from left to right and top to bottom. However, it uses different elements and specific symbols for defining different entities or actions. Some such elements are listed below:
- Rectangle: It is a box with straight corners (making an angle of 90 degrees) and is typically used to represent process stages.

- Rectangle with round corners: It is a rectangle but does not conclude the straight corners. Instead, it has round corners used for marking starting and terminating stages of the process.

- Parallelogram: It is a box where the sides have little stretched. The parallelogram is used to illustrate data input/output.

- Diamond: It is a box in the form of a diamond but in a 2-D shape. The diamond used in a flow chart typically marks conditional branching.

- Arrow: It is used to show the process flow through the entire process.

The above elements are the most commonly used in a flow chart, but they are not limited to only these. There may be many other elements depending on the requirements or the like.
How to create a Flow Chart in Excel?
Creating a flow chart is not the same as creating other typical charts in Excel. However, there are many ways that we can leverage to create a flow chart within the Excel sheet. The most common methods are as follows:
- Creating a Flow Chart using the Shapes
- Creating a Flow Chart using the Smart Arts
- Creating a Flow Chart using the Templates
Let us now discuss each in detail:
Example 1: Creating a Flow Chart using the Shapes
Since the flow chart concludes with different shapes connecting with arrows, we can use Excel built-in shapes to create a flow chart in a sheet. Let us create a simple flow chart that illustrates the flow of communication in an organization. Generally, the organization flow chart includes the following flow:
Founder > Head Departments > Managers > Team Leaders > Team Members
To create an Excel flow chart for the above flow, we must perform the following steps:
- First, we need to remove the gridlines from the active sheet. Although it is not compulsory, it will make the flow chart clearly visible or easy to read. For this, we must navigate to the Page Layout tab and untick the checkbox associated with View under Gridlines.

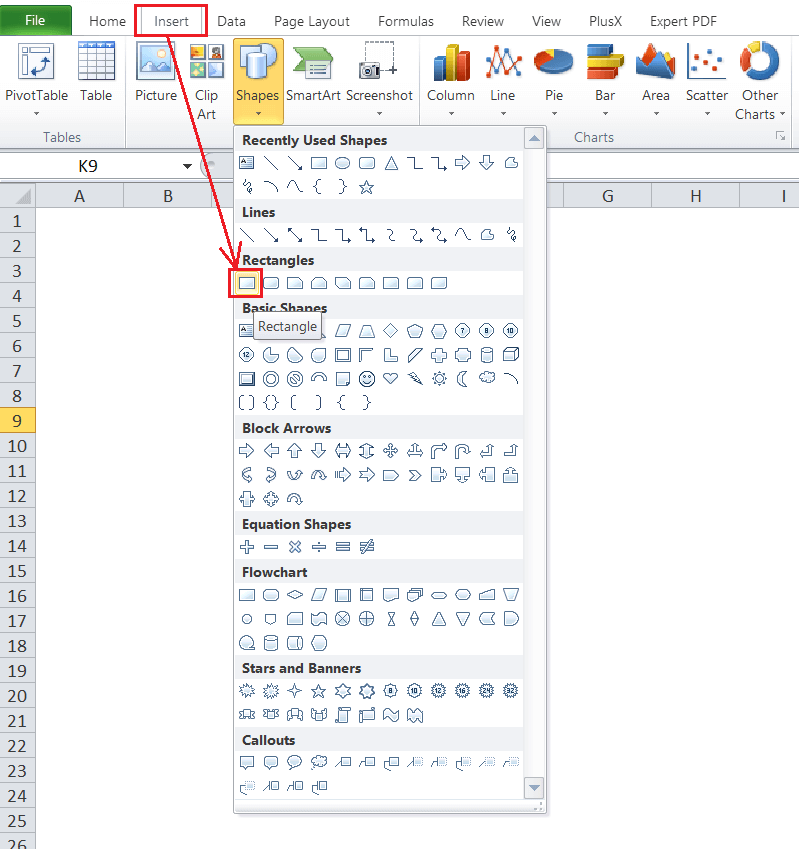
- Next, we need to go to the Insert tab and click the drop-down icon linked with Shapes. It will display all the built-in shapes present in Excel. We need to select the rectangular shape under Flowchart and draw it the using mouse, as shown below:
We can adjust the box to fit according to the column/row ends by holding the Alt key and dragging it through the mouse. - Next, we need to insert a desired text within the box. For this, we must press a right-click on the inserted box and select the Edit Text option.

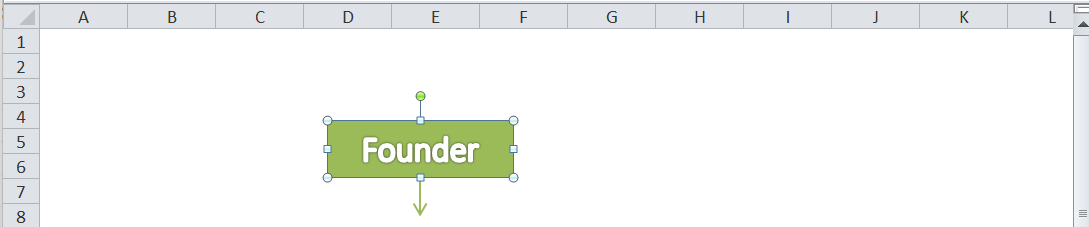
After that, we can enter the desired text using the keyboard. For our example, we type the text ‘Founder’ in the box.

We can also adjust the formatting and style of the box or text as per our requirements. However, to keep it a typical flow chart, we only remove the box’s border and change the size & color of the text.

- Once we have the first box for the organization flow chart, we must insert an arrow from the shapes to define the direction of the process to the bottom side, as shown below:
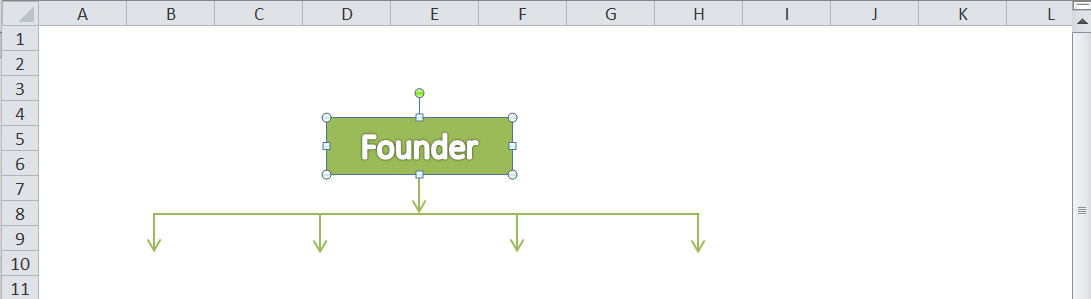
After inserting an arrow from the first box, we must insert a straight horizontal line below the arrow. If we consider four head departments in an organization flow chart, we need to insert four arrows like the image below:
- We must again insert a rectangular box below each one of four arrows. Next, we insert a text within each box, mentioning the particular heads’ departments.

In our example, we insert four boxes for head departments. However, we can insert more or less as per our requirements. - We need to insert four arrows from the mid-bottom of each box of head departments and attach four more boxes. We then insert texts (Manager in our example) in each box.

Likewise, we insert four more arrows and boxes for team leaders.

- Next, we need to insert vertical straight lines in the left-bottom of each team leader box and insert horizontal arrows connecting to straight lines in the following way:
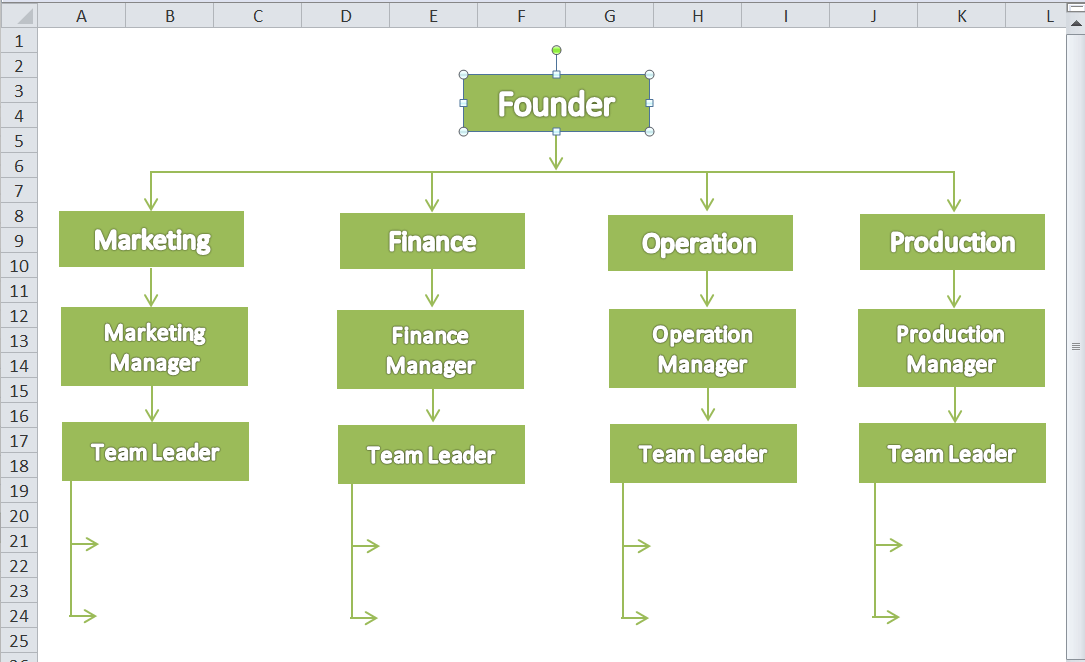
- Lastly, we must insert rectangular boxes connecting to each remaining arrow and enter text for executives like the below image:

This is the simplest method to create a flow chart in Excel. In the above organization flow chart, a flow of communication is clearly visible.
Example 2: Creating a Flow Chart using the Smart Arts
Another easy method to create a simple flow chart in Excel includes the use of the Smart Arts. Excel consists of several SmartArt Graphics by default, which can help make a beautiful flow chart. Although SmartArt Graphics has some specific process diagrams, we can make changes accordingly.
Let us consider common steps for establishing an organization and draw a flow chart using Excel SmartArt Graphics.
- First, we need to remove the gridlines from the Excel sheet to make a chart look visually clear and informative.
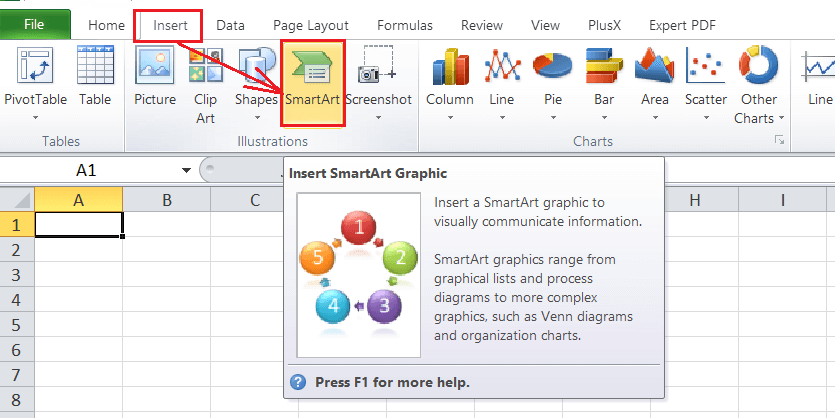
- Next, we need to go to the Insert tab and click the SmartArt icon, as shown below:
- Under the SmartArt Graphics window, we need to click on the Process option from the left side of the window. It will display many process-driven graphics. However, to create a good flow chart, we need to scroll down and choose the Repeating Bending Process graphic.

- After choosing the desired process-based graphics, we will get the default flow chart in our Excel sheet. In our example, we get the default Repeating Bending Process diagram, as shown below:

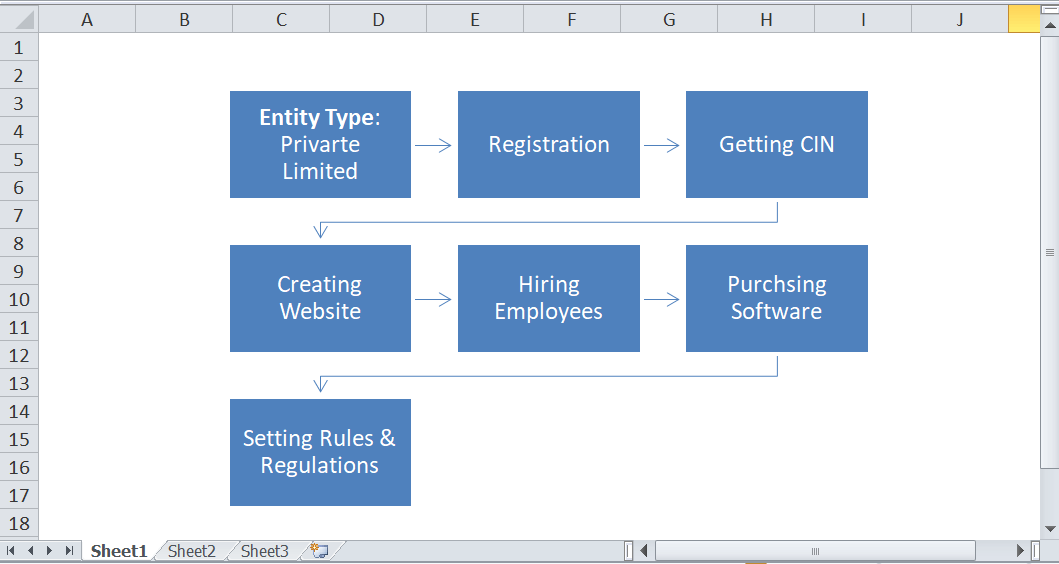
- After we get the default flowchart, we must edit the text and type as per our requirements. Since we are creating a flow chart for establishing an organization, we will include steps accordingly. For example, deciding an entity type, registering a company, getting a CIN (Customer Identification Number), creating a website, hiring employees, etc. After entering texts in boxes, our example flow chart looks like this:

- Suppose we want to add more boxes in our process flow. Then, we can select the existing shape (particular box, arrow, etc.) and paste it into the same sheet. We insert two more boxes to establish an organization, insert texts to purchase software, and set rules for employees. After that, our example flow chart looks like this:
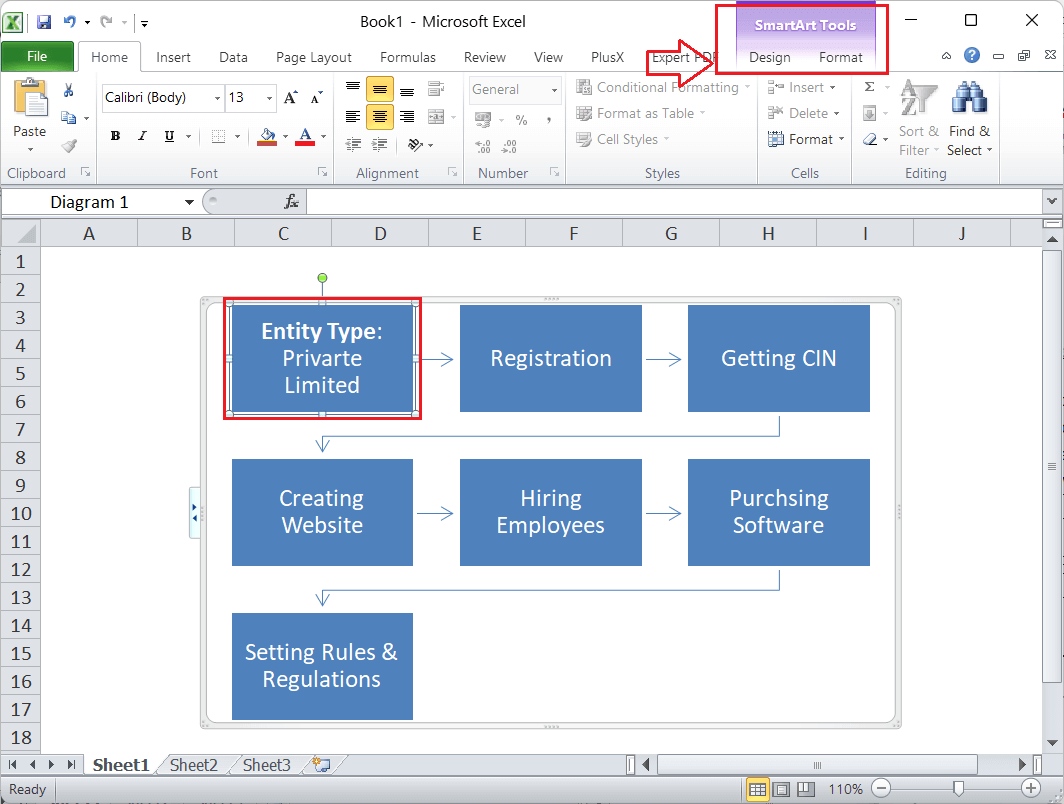
- Once the complete chart has been inserted, we can select any chart elements and arrange design or formatting accordingly. As soon as we select the flow chart element, we get new tabs on the ribbon. Using tabs, we can adjust shape colors, text color, font size, styles, etc.
After adjusting some formatting and style, our example flow chart looks like this:

Example 3: Creating a Flow Chart using the Excel Templates
The third and the easiest method to create a flow chart in Excel includes using Excel templates. Excel has a large collection of pre-designed templates that help us quickly start on respective projects or tasks. When creating a flow chart in Excel using the templates, we must go to the template store and search for ‘Flow Chart’. Excel will display many templates, and we can select the desired one and start working by editing its elements accordingly.
Alternately we can navigate to the official website (https://templates.office.com/) of Microsoft Templates and search from there.

After the template has been found, we can download it on our device and open it using the MS Excel software.

Once the template is opened in Excel, we can make necessary changes and adjust the formatting and styles as per our requirements.
Important Things to Remember
- We can use different shapes to give beautiful visual effects to our flow chart.
- We can use different colors for each shape to make the flow chart look more attractive.
- When creating a simple flow chart, it is better to use SmartArt Graphics.
- When creating a complex flow chart, it is better to use shapes. Furthermore, we must save the flow chart as a template to use in the future with modifications as necessary.
- When creating a flow chart using templates from the store, it is important to remember that all templates are not free to use.


